I wrote this guide for the ultra-beginner, ie. me three years ago. This is the guide I wish I had before I dived head-first into the GameStop short-squeeze of early 2021. Prior to that, I had dabbled on-and-off unsuccessfully in my Robinhood account with no real strategy and lost quite a bit there. But being the stubborn person that I am, I refused to give up. Over the last two years, I have relentlessly educated myself on the stock market. I read books, watched YouTube tutorials, practiced on simulators and with paper money, followed experienced swing traders and day traders closely, and experimented with different asset classes and strategies. I watched and traded market movements nearly every single day for two years before I started grad school, and now even in grad school, I continue to do a bit of low stress swing trading as a hobby. Experimentation costs time and money, but it is the premier learning tool. Although I am by no means an expert, I hope that this guide can give you the tools to have a better starting point in your trading journey and save you some of the pain of FAFO.
Note: If after reading this, you found it useful and want to support me, please be a good friend and use my Webull referral link to sign up if you don’t already have a Webull account. And no, I am not paid by Webull to write this. I just happen to like them.
Introduction
Unless you are born in a rich family with a golden spoon in your mouth or your parents actively invested and shared their investing knowledge with you, most people (in the United States) first learn about the stock market when they start working and are asked if they want a brokerage firm to invest their 401k retirement money as part of their benefit package. In your first job, you get a brochure about the benefits of compound interest that show you graphs of exponential growth assuming constant rates of return, showing you how you can turn that $1000 into $1 million so that you have enough money to retire by the time you’re 70 years old. They’ll tell you that the sooner you start doing this, the more money you’ll have, and that you definitely don’t have to worry about anything, just trust them to invest your money for you. For example, here’s a chart from such a brochure from Fidelity:
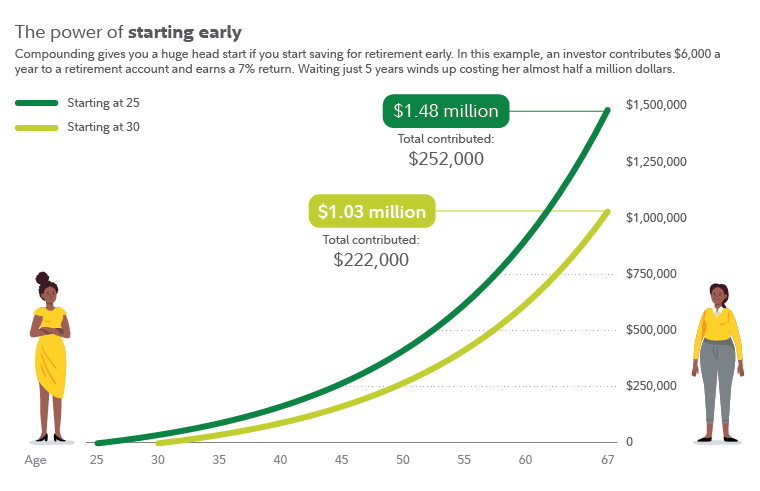
Spoiler: There’s nothing further from the truth. My parents, aunts, uncles, and relatives have all done this for 20+ years and have yet to become millionaires.
The other way people typically hear about it is through the expert beginner kind of investor. Usually this is through a retire friend or family member (like your grandparents), for whom the strategy of DCA (dollar-cost averaging) actually worked due to the insane bull run from the 1980s to the early 2000s, and then from the recovery after the 2008 crash all the way until the start of the recession of 2021. These people will tell you the following untrue things:
- The market behaves irrationally. Because market moves are random, you are just gambling.
- You cannot time the market. You cannot beat the market. Most people who try to beat the market will lose money.
- Just buy index stocks and DCA (dollar-cost average) in. Buy at fixed intervals regardless of price, and just plan to hold forever.
- Diversify your portfolio. You don’t know which ones will go up or down the fastest, so it’s better to have multiple horses in the race.
- Nobody has ever lost money by holding in the market for over 20 years.
If you follow these during a normal bull market, it will indeed work for you. But just like the doctor who only sees healthy patients and does not know what to do when a patient with a rare disease comes in, most DCA investors are not prepared for bear markets or recessions like the one we’re saw in 2022 and are likely to see a few more times in our lifetime. If like me, you believe there is more to the stock market than what the brokerage firms or your retired relative tells you, read on. I believe you will find a lot of value in what I’m about to share.
Table of Contents
- Playing the Game
- How Do I Get Started?
- Account types: Margin vs. Cash accounts
- Choosing a Brokerage
- Other Important Tools (TradingView and Replay App)
- Asset classes
- Stocks
- Cryptocurrency (BTC, ETC, and Altcoins)
- Options
- Trading Styles and Methodologies
- Investing with Stocks
- Swing Trading with Stocks
- Day Trading with Options
- Buy the Rumor, Sell the News
- Short Squeezes and Meme Stocks
- Earnings Plays with Options
- Example Trades
- Swing Trading with Stocks (NVTA)
- Day Trading with Options (TradingView)
- Buy the Rumor, Sell the News (TMO)
- Earnings Plays with Options (META)
- Important Resources
- Outro
Playing the Game

The market is like the ocean. It reflects the movement of massive institutional players, and you either move with it and get rewarded or move against it and get destroyed. There is no in-between, and the market does not care about your feelings. The goal of trading is to buy and sell in such a way so as to maximize your profits and minimize your losses. This is measured via a metric called the PNL (profit and loss).
Have you ever watched some shill from YouTube who strongly recommended for you to buy some stock you’ve never heard of because it’s going parabolic, ultimately to end his pitch with “of course, do your own analysis” as a cop-out to deny responsibility for making you buy that stock near the top? Well, you’re not alone. As a new trader, when I heard that phrase, I thought that meant looking up analyst opinions on TipRanks, reading company news about the underlying stock, reading economic news, or trying to evaluate current sentiment about the stock. In fact, this is known as fundamental analysis, and this is what most people think about when they hear the phrase, “do your own analysis”. However, while fundamental analysis can be important in the ultra-long term (ie. years), there can be a lot of unpredictability in between now and the distant future. So doing fundamental analysis only tells you whether a company is worth looking at, not when or how to buy and sell, which I believe is far more important. The art of getting the proper entries and exits is the domain of technical analysis. Technical analysis is general. It can be applied to any stock, ETF, cryptocurrency or other asset, works on every time frame (from the 1 minute chart to the daily chart), and is the most important skill to learn to trade the market effectively.
Technical analysis is the study of market movement. The key principle underlying technical analysis is that markets move between lines of support and resistance. This movement is called price action, and the strength of the move is measured by the volume of transactions during the move. Your goal as a trader is to move with the market, which involves timing the market. This can be done approximately, which makes it more of an art than a science, but it’s important to note that it can be done.
Do NOT listen to the naysayers who tell you that market moves are completely random and unpredictable, because there are indeed people who can do it with astounding accuracy and make a living by trading full time (I will link some below). It is true that for every person who is profitable, there are many more people who lose money in the stock market. It takes a lot of time, training, practice, and discipline to become consistently profitable, and most people simply quit before putting in the work. It’s also important to know that you need to have a real edge in order to win, simply having discipline is not a winning strategy.
In order for you to be profitable, you MUST believe that the market makes sense, that you can train yourself to recognize patterns, and you have the discipline to develop good trading habits and practice for more than a few months. Like a game of blackjack, trading is a probabilistic game, meaning that the outcome may vary. What makes things worse is that the market sometimes rewards bad practices and punishes good practices. So it is of utmost important that you develop good habits and have the discipline to stick things through and follow your plans instead of changing them at a whim (which sounds easy, but in practice is extremely difficult to accomplish when real money is on the line). If you can do these things, I promise you will become consistently profitable in the long run.
How Do I Get Started?
Depending on where you get your information, it could be really overwhelming, so the goal of this section is to introduce the important tools you will need, as succinctly as possible.
Account Types
Summary: There are pros and cons to both margin and cash accounts. It is helpful to have one of each for different purposes.
Margin Account
A margin account is a type of investment account in which you deposit some cash with the brokerage, and your brokerage gives you margin, or extra cash, to invest. For example, if you deposit $5,000 into your account, your brokerage will allow you to buy up to $10,000 for overnight positions. Using more cash than you have on hand is called using leverage, and it’s something that in my opinion, should NOT be used unless you are an experienced trader, and you know that the macroeconomic conditions is favorable and we are in the midst of an insane bull run, which is NOT true currently in July 2023, as we are supposed to be due for a recession that is not yet reflected in the market. Trading with leverage is inherently dangerous, because if you dip negative, for example, you buy $10,000 worth of Tesla and the stock drops by 50%, your brokerage will send you a margin call, in which they ask you do either deposit more cash, or they will close your account at a loss and you will still owe them money. Another drawback of using leverage is that you are charged interest on the money you borrow, so you really do not want to be in long-term positions on leverage. The most responsible way to use leverage is to close the position a few days after opening them so you don’t expose yourself to a lot of risk.
There’s another restriction on margin accounts called the Pattern Day Trading rule, or PDT rule for short. A day trade is defined as buying and selling the same security (yes, this applies to options too) in the same day (including pre-market and after-hours trading). If your margin account does not have over $25,000 in cash deposited, you are only allowed to make 3 day trades every 5-day period. Going over this limit is known as a PDT violation, and your brokerage will typically restrict your account for 90 days, meaning that depending on the brokerage, your account will either be set such that you can only close existing positions and cannot open new positions, or your account will simply be frozen (no buying or selling at all). For your first PDT violation, most brokerages give a one-time free reset, but after that, the only way to resolve PDT violations is to either deposit enough cash such that your account has more than $25,000 deposited or wait out the 90 days. The best way to avoid this is to monitor the number of day trades. Most brokerages will have some kind of warning if you’re about to make the fourth day trade.
Note that an important loophole with the PDT rule is that it applies independently for each of your brokerage accounts. For example, if you have a Webull account and a Robinhood account, you can make 6 day trades a week total, 3 in your Webull account and 6 in your Robinhood account. However, if you have two Webull accounts, you will still have 3 total. I recommend caution with having too many accounts, because it can become confusing to track your overall performance if you’re constantly switching between platforms.
So with all these restrictions, why would you ever want a margin account? The main reasons are:
- Settlement time. Cash from selling securities becomes instantly available for you to use in buying another security, which is not true for cash accounts.
- Leverage. If the market is skyrocketing, using leverage to maximize your gains is ideal, but this is also a double-edged sword.
- Options strategies. You can only perform complex options strategies in a margin account. Such option strategies include selling naked calls and puts, options spreads, and iron condors. BTW, I don’t recommend any of these to beginners, but it’s good to know that they exist.
If you are holding positions overnight, it’s far better to do it in a margin account, because it really forces you to be more thoughtful about your entries. If you are opening and closing positions on a whim, that means you’re not getting good entries, and patience is the biggest virtue in this game.
Cash Account
A cash account is a type of trading account in which you deposit some cash with the brokerage, and the brokerage only lets you trade up to that amount a day. With a cash account, you can make as many day trades as you want, as long as you have settled funds. For example, say you deposit $1,000 into your account. You buy 5 shares of Apple for $140 for a total of $700, but changed your mind, so you end up selling at the same price. Your account now has $300 of buying power, or settled funds, and $700 of unsettled funds. You get that buying power once your funds settle. For stocks, the settlement time is T+2 days, meaning if you sold your stock on Monday, the funds will be available for you to use again on Wednesday. For options, the settlement time is T+1 days, meaning your money becomes available the next day.
The main restriction on cash accounts is known as the Good Faith Violation rule, or GFV rule for short. For reasons I can’t comprehend, brokerages will allow you to trade with unsettled funds. You should avoid doing this, because if you do it more than 3 times (ie. 4 times) in a rolling 12-month period, your account will be restricted to closing-only for 90 days. After you wait out those 90 days, if you do it again, most brokerages will close your account and prevent you from opening another one, ie. they will ban you. I’m not sure why you would ever choose to do a GFV, so just don’t do it.
Since the settlement time for stocks is T+2 days, if you are a savvy investor and want to rebalance your portfolio, this is not an ideal account to do it in. However, since the settlement time for options is T+1 days, this makes cash accounts ideal for single-leg options trading.
Summary
If you’re going to investing in stocks in the time frame of days, weeks, months, or years, use a margin account. If you’re going to day trading single-leg options, use a cash account. It is helpful to have both. Many brokerages, like Webull, will allow you to open one of each account type. However, they will only give you complementary OPRA real-time options quotes on one account, so I would recommend you put that on your cash account.
Choosing a Brokerage
There are two types of brokerages: traditional brokerages where buy/sell orders require you to fill out a web form, and modern zero-commission brokerages with good charting. Here’s a table comparing the ones I have used and my opinions on them.
| Brokerage | My Rating | My Opinion |
|---|---|---|
| Webull | Best | This is the best brokerage available, because it is commission-free for stock trading and has low commission fees for options trading. In my opinion, Webull’s advanced charting tools are the absolute best on cell phones, and even better than TradingView’s. You can open a cash account and margin account and switch easily between them. They have good execution, and the dashboard for your trading history is the best I’ve ever seen. In addition, they have free paper trading, including paper trading options. Furthermore, although they make money on the bid-ask spread, their spread is much tighter than Robinhood’s (except for crypto). In summary highly recommend opening a Webull account. |
| Thinkorswim | Good | I haven’t personally used this much. Their phone app user-interface was complicated to me, although people say that the desktop app is impeccable. An advantage it has over Webull is that it has a good stock scanner to show the biggest movers during pre-market hours, which could really set you up for the day if you tend to trade small-cap stocks. I can’t really comment on this though, since I prefer not to trade small-cap stocks that I’ve never heard of. If this is something you are interested in, I would recommend following ZipTrader on Youtube. |
| Robinhood | Bad | This is the most beginner-friendly app, but that’s the thing. It’s like riding a bicycle with training wheels. Your charting tools will be extremely limited, and Robinhood only allows you to create margin accounts, meaning you will be subject to the PDT rule (unless you’re already rich). Although Robinhood touts being commission-free, they actually do this by artificially expanding the bid-ask spread, and they sell real-time orders data to high-frequency traders so they can front-run you, meaning you will get worse execution, ie. if you use market orders, they will fill significantly (ie. a few cents) higher than market price, and if you use limit orders, sometimes they don’t fill when the market price is at your limit price. This is especially noticeable for crypto trading. In addition, their user interface encourages gambling, with them displaying front-and-center the biggest movers of the day, which most of the time will give you FOMO rather than being helpful. |
| Charles Schwab | Okay | I have this because I worked at a small startup that gave me a Personal Choice Retirement Account (PCRA), which is a cash account. Since I have less than $2,000 in here, I dabble in here from time. Their UI is a clunky web form. You have to enter everything. Whether your order is buy/sell, how many stocks (most brokerages will let you click a +/- button), what price (most brokerages will autofill at the market price and you can adjust up or down). Since you have to type everything, it takes longer to submit orders, especially since you have to type in the price and scroll up and down to see the current market price before you type something in. By the time you submit your order, the market price will definitely have moved. After you submit the order, you need to go to a different web page to actually see if your order filled. I’ve found the execution to be mediocre: if you set a limit buy and the market price falls to that price, the order will typically get executed (unlike Robinhood). The dashboard tools are pretty terrible though, there are no useful metrics to keep track of how well your trades are doing, they simply display your total account value over time, including deposits and withdrawals, so it becomes very difficult to keep track of your PNL. |
| E*Trade | Okay | I had this because a former employer gave me RSU’s here. They’re kind of like Schwab. The web form was extremely clunky. I didn’t use them much, but I do remember having no issues executing the sell order when I was ready to ditch the RSU’s, and I didn’t have any issues transferring the money out. |
| Fidelity | Worst | I also had this because a former employer gave me RSU’s here. Like Schwab, they also use a web form, but unlike Schwab and E*Trade, they executed my order RIGHT AWAY without a confirmation page. Also, they executed my limit order at EXACTLY the price I set. Usually if you set a limit order and the market moves away from your limit price, the brokerage will execute you at the market price. For example, if you create a limit sell order to sell a stock at $560 and it moves up to $565, the brokerage should sell your shares at $565. But Fidelity will sell your shares at $560 and run away with your $5 difference. It was quite shocking to me that this control wasn’t in place, which makes me rate this as the worst brokerage. Unfortunately, a lot of big companies will use Fidelity to distribute RSU’s, because they’re a well-established company. |
| Coinbase | Good | This is the de-facto crypto brokerage in the US. Crypto trading is inherently dangerous, because it is a space that widely lacks regulation. There are many examples of crypto brokerages going bankrupt and people losing all their money, the most recent being the collapse of FTX. If you are worried about this, Coinbase is the way to go. In the very unlikely event that they do go under (since they are a US based company), Coinbase will probably pay you out, because they have FDIC-style insurance (note: not the actual FDIC) for their customers. One drawback is the high fees, Coinbase has one of the highest maker/taker fees on the market. However, at least they ARE transparent with the fees, because the way that Webull or Robinhood sets their crypto fees is by artificially inflating the bid-ask spread, so it’s easy to miss. The crypto market had been in massive downtrend since September 2021, and we are in the middle of a crypto winter. I ended up selling all my crypto from Coinbase and withdrawing my cash due to the high fees. |
| Binance.US | Was good, now uncertain | This was my favorite Coinbase alternative. Their biggest draw is that they had the lowest fees, and then in 2021, they eliminated fees for Bitcoin and Etherium altogether. This is perfect, because in my opinion, these are the only coins worthy of buy-and-hold. The rest of the crypto market behaves largely like pump-and-dump schemes. More on this later. A major advantage of using an actual crypto brokerage (Coinbase, Binance.US, etc.), in comparison to a stock brokerage that lets you buy and sell crypto within the brokerage (Webull, Robinhood, etc.), is that you can transfer that crypto out to your hardware wallet (Trezor, Ledger, etc.). Although I don’t consider Binance.US to be on par with the safety of Coinbase, buying and transferring out means you’re safe, because your keys, your coins. That way, in the event that the brokerage does go down, you will still have your crypto, even if there is the risk you might not get your cash back. Holding on a hardware wallet also makes it harder to buy/sell on a whim, because the act transferring itself is cumbersome and comes with gas fees. One important thing to note is that Binance.US is a separate company from Binance, the Chinese company headed by CZ, so it may not have the same safety as the larger parent company. Unfortunately, as of July 13, 2023, due to an SEC lawsuit, you can no longer use them to buy BTC and ETH directly with USD. Hopefully, this will resolve in the next year, as we are on the cusp of entering another crypto bull run due to the upcoming halving. |
Other Important Tools
Aside from brokerage accounts, there are two tools you should be aware of: TradingView and TradingTerminal’s Trading Replay App.
TradingView is the MOST advanced charting tool on the market (even more so than Webull). They are on a fremium model, you can (and probably should) pay for more features if you’re going to use them. If you are going to use one of the brokerages that don’t come with advanced charting tools (Robinhood, Charles Schwab, etc.), and for some reason, you don’t want to use Webull, I highly recommend pairing your trading activities with TradingView. That way, you will have the ability to draw support/resistance lines, trend lines, and have indicators so that you know where to buy/sell. TradingView also has a trading replay app, so you can see a bar-by-bar replay of the market after the day’s over as practice for day trading. Finally, they have the best annotation tools, you can comment on specific points during the day and use it to analyze your trades. If you’re on the free tier, you can analyze up to about a week in the past, but you pay for a subscription that lets you access market data years in the past.
TradingTerminal’s Trading Replay App is the best free market replay tool that I’ve found. Most of the good ones I’ve found require you to pay a subscription fee to use them, but this one comes for free. This is better than the bar-by-bar replay that TradingView has, because seeing the candles move in real-time is a good simulation of what you will see in the actual market. This is how you can get screen time and practice in day trading without having to pay money. Pick a random day, then watch the market. Buying 100 shares is similar to buying a call or closing a put, and selling 100 shares is similar to buying a put or closing a call. You can fast-forward up to 10x speed so you don’t have to sit there for the whole day while training yourself, and you can access any day in history to make sure you don’t already know how that day will play out, ensuring that you’re making decisions as the information is presented to you.
Summary
There are two account types: margin and cash accounts. Most brokerages offer both, and it is beneficial to have one of each type, the margin account for swing trading, or buying and selling overnight positions, and the cash account for day trading, which is buying and selling positions within the same day. These concepts will be clarified in the strategy section later. If you plan to trade crypto, it is advantageous to open an account with a crypto brokerage. If you plan to use a traditional dinosaur brokerage, you can pair your trading activities with TradingView’s charting tools, which will help you with your entries and exits. If you plan to day trade, having screen time on the Trading Replay app is paramount to your success. Finally, for your main brokerage, I highly recommend Webull, because having the best charting tools, real-time data, great execution speed, the ability to quickly switch between a margin and cash account, and amazing dashboards to provide meaningful feedback on your trades are all invaluable tools to have in one place.
Asset Classes
Most people have a basic understanding of stocks, heard of cryptocurrency from the news, and are not familiar with options. Rather than explaining WHAT each of these things are (eg. stocks represent a fraction of a company), the goal of this section is to introduce how you could use these asset classes as tools for financial gain. Since I personally don’t trade futures contracts, it will not be covered.
Stocks
This is the asset class that most people are familiar with. Although you can look at stocks as a representation of the underlying company, I’ve seen too many examples of stocks whose value becomes decoupled from the real value of the underlying company (GameStop, AMC, Rivian, Coinbase, etc.) for this view to be useful. So how does a stock get its value? The answer to that question is that the value of a stock is determined by the price of the last transaction on the open market. This is best illustrated by the following example.
Suppose there is a neighborhood with 100 identical homes, and 10 of them are on the market for an asking price of $500K. Then, 7 people purchased those homes for $500K each. Now there are only 3 left on the open market, and there are more than 3 people who want those houses. The owners of the remaining houses realize that they can get more than $500K for each home, so they relist their homes for $600K, $800K, and $1M. The remaining people aren’t happy about that and continue to bid $500K, but finally one person acquiesces and purchases the $600K home. Then another person acquiesces and purchases for $800K. Now there’s one house left listed at $1M, but nobody wants to touch it. At this point, since the last transacted price for a house is $800K, this is the current market price of all the houses. Some of the original group of 7 people realize their property can be sold for nearly double of the original value, so they start listing their houses. But they want to cash out before the $1M listing, so they list their houses at $900K. Someone buys at this price. The other 7 start lowering the asking price to try and out-compete each other. Pretty soon, they’re listing $800K, which sells, $700K, which sells, etc. Finally, the house drops back to $500K, and someone sells their house for $400K. Now the “current market price” of all the houses is $400K, and everyone who bought it at $500K has “lost” money. People try to list at that price, but nobody will buy unless it’s $400K. Eventually, 20 homes are purchased for $400K before someone finally buys at $500K again.
From this example, here are the basic concepts about price movements:
- The bid price is lower than the ask price (eg. when the bid was $500K and the ask was $600K). A transaction occurs when a buyer purchases at the asking price or a seller purchases at the bid price.
- The price of the asset is determined only by the last transaction on the open market. When the “current market price” was $900K, theoretically everyone’s house is worth $900K, because they are all identical.
- Prices go up when there are more buyers than sellers, and prices drop when there are more sellers than buyers.
- The strength of the pricing depends on how many people are willing to buy/sell at that price, ie. the volume. In this example, the prices were stable at $500K, but only went up to $600K, $800K, and $900K briefly before crashing back down to a stable price at $400K.
- When there are only a few homes and a lot of buyers, prices increase rapidly, because there is low supply and high demand.
- If you want to have made money in this scenario, you have to be one of the few to sell when the price went up. When the price went down to $400K, everyone “lost” money, even though it was unrealized losses. The prices went there because there was high supply and low demand: 20 people tried to sell their house at $400K, but it took a while to find 20 buyers.
One thing that I’d like to emphasize here is that just because the current market price is a certain amount, that doesn’t guarantee you will be able to cash out that price. In the real world, a squeeze or price-spike like this one is brief and short-lived, and if you FOMO into it at the top (someone will ultimately buy the top), then you will be trapped (or have to sell at a loss). On the buyer side, it was low-risk to buy the house at $500K, slightly higher risk to buy at $600K, and VERY risky to buy at $900K. On the seller side, it is low risk to sell the house at $900K, riskier to sell at $600K, and VERY risky to sell at $400K.
Because the “current value” of a stock is determined by the last price, stocks belonging to large companies have the greatest price stability, ie. least volatility, because they have large volume of transactions at all times. This guarantees that it will be very difficult to move the price, because in order to increase the price by a meaningful amount, there must be enough buyers to take out all of the sellers such that the only sellers left are the ones selling at higher prices. Likewise, in order to decrease the price by a meaningful amount, there must be enough sellers to take out all of the buyers such that the only buyers left are the ones willing to buy at lower prices. Because there are many transactions going on at all times for these large-cap companies, you can usually guarantee that you will be able to sell at least for the fair current market price when you want to. The same isn’t true for many small-cap no-name companies that you’ve never heard of.
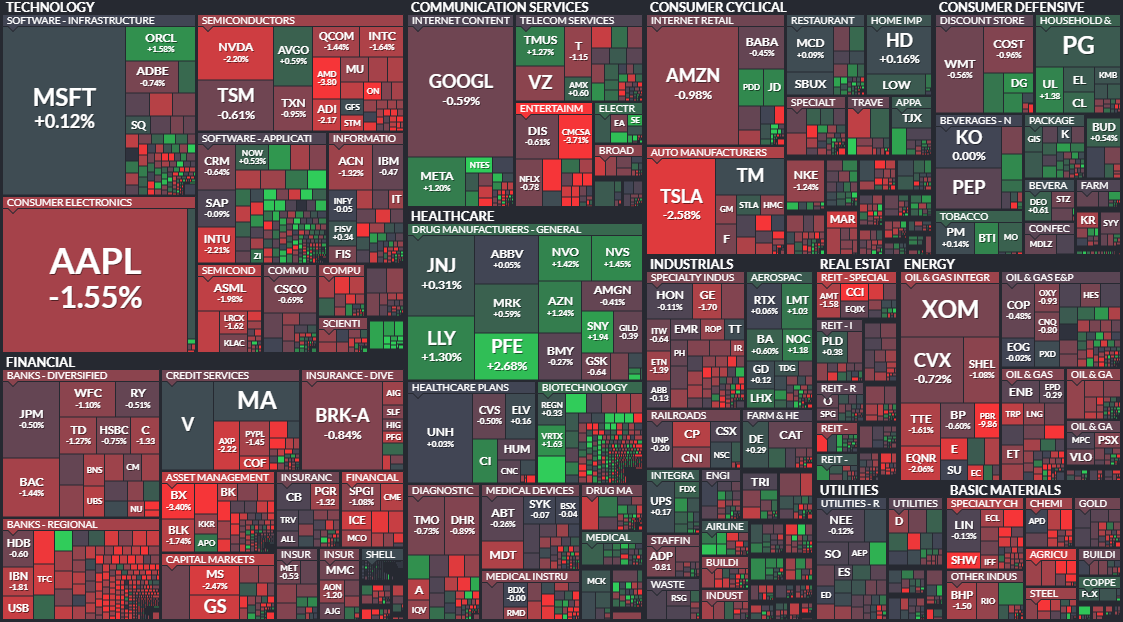
In the real world, what causes stock prices to move? The answer is that people, especially large institutions, buy and sell them at a whim based on market news. When they buy or sell, they usually do so in a way that affects multiple assets in their portfolios, creating great correlation between different stocks, especially in a given sector, such as tech, electric vehicles, gas, or airlines. Therefore, I think it’s better to start with a higher-level overview of the market overall before going into individual stocks and how to categorize them.
There are three main barometers of the markets: the S&P 500 (SPX), the Nasdaq (IXIC), and the Dow Jones Industrial Average (DJI). Each of these are index funds that average a very large numbers of companies. Each main index fund also has an exchange-traded fund, or ETF, version that trades at roughly 1/10th of the value of the main index fund: the SPY, QQQ, and DJA, and options are available for each ETF. Additionally, each ETF has inverse ETFs, which do the opposite of what the ETF do: the SPXS, SQQQ, and SDOW. Finally, there is a fourth barometer called the VIX, or volatility index, that spikes up when stocks crash and then drift downward as the market inches up. You cannot trade the VIX directly, but options are available on the VIX, and there are leveraged ETFs on the VIX such as VXX or UVXY (which I very much don’t recommend trading unless you know what you’re doing).
The starting point for any trade is to first look at the market ETFs to evaluate what you think the overall market may be doing. (Note: It is better to look at the ETF instead of the index fund, because unlike the index fund, the ETF can be traded during pre-market, which often contains really important information.) These ETFs are like the winds blowing across the ocean. Bear with me on this analogy. Say that you are standing on a cliff and watching a few sailboats sailing in the open sea. Most of them are moving with the wind: some are faster, some are slower. One of them is going against the wind for some reason. The ETFs are like the wind, and the stocks are like the individual sailboats. Averaging the velocity of the sailboats tells you something about the wind speed. If I have multiple open positions, looking at the SPY will typically give me a good idea of how much my investments increased or decreased for the day.

According to Warren Buffet, diversification is the great myth to protect investors from their own stupidity. Based on my experience, this is profoundly true. This is because market movements are largely due to macroeconomic conditions, so for example, when Jerome Powell announces in a FOMC report that high interest rates will be held there for longer than expected (eg. on Wednesday, December 14, 2022), it doesn’t matter if you’re holding (AAPL), Costco (COST), Chevron (CVX), an airline stock, etc. The entire market is falling.
Where this diversification matters is if you know in some very specific circumstance that a specific sector will outperform other sectors. For example, in the buildup to the Russian invasion of Ukraine in 2022, some savvy investors, like Warren Buffet, realized that there will be a massive global oil shortage. So getting into oil stocks like Occidental Petroleum (OXY) or Chevron (CVX) would have been very profitable if you got in before the invasion. Of course, there was the risk that if the invasion didn’t occur, those stocks would rapidly fall back to fair value, but in hindsight, the invasion did occur, and most oil stocks more than doubled as a result.
Within the context of the overall market, it’s better to buy stocks that are well-known and frequently traded, ie. have high liquidity. These companies typically have high market capitalization and form a significant portion of the S&P 500, eg. Apple (AAPL). Although their prices don’t move as much compared to the prices of small companies (ie. they are less volatile), their price action tends to be a lot more predictable, and predictability is the name of the game.
Before you begin investing, it is helpful to compile a list of companies that you personally like in the sectors that you like, then narrow that list down to a handful per sector and only focusing only on sectors you like or understand. People differ in what they agree the market sectors are, but here are the 10 categories that I use: tech, retail, oil and utilities, entertainment, services, airlines, banks, electric vehicles (EVs), biotechnology, and meme stocks. Each of these sectors correlate with the overall market, but as mentioned above, sometimes one sector will move more relative to other sectors. For example, EVs had a much steeper decline in December 2022 compared to the overall market due to chip shortages, COVID in China, Tesla underperforming, etc. Starting January 2023, when ChatGPT really took off, AI and tech stocks really took off, with NVDA more than quadrupling from its lows. Within each sector, the largest companies will be the most stable or predictable, and the smallest companies will be the most volatile.
After you’ve identified some stocks you like within each sector (and it’s okay not to have all of them), put them in an organized list in your brokerage account so that you an easily refer to them. You can expect the stocks within each sector to have the most correlation with each other, but they will flash buy/sell signals at different times, which you can identify using technical analysis, which will be explained below in the strategy section.
In practice, even though you’ve done your analysis on many different companies, you will only be actively trading a handful of them (8 or fewer). If you diversify too much, it will prevent you from seeing the bigger picture, and you may miss buy/sell signals from your individual stocks. For example, much of my profits from September to December 2022 were made exclusively using Facebook (META) (tech stock), Apple (AAPL) (tech stock), Costco (COST) (retail stock), Occidental Petroleum (OXY), and Invitae (NVTA) (a meme stock), and that was enough. The other stocks in each sector and other sectors seemed irrelevant to me during this time. Your favorite stock picks will probably be different from mine.
Cryptocurrency
Never mind what cryptocurrency is. You could go into the weeds on cryptographic hashing, the Bitcoin ledger, how transactions work, the double-spending problem, mining, etc. That’s all irrelevant for trading crypto, because chances are you will be doing it in a brokerage like Coinbase or Binance.US. Yes, I am aware there are ways to buy, sell, or transfer crypto without going through a brokerage, but that’s not going to be covered here.
The easiest way to think about the crypto space is that Bitcoin (BTC) is king, Etherium (ETH) is second, and everything else is an altcoin. So Bitcoin is like the SPY of the crypto space. If Bitcoin goes up, everything will probably go up, and if Bitcoin falls, everything will probably fall too. Altcoins largely act like meme stocks, they fall nonstop, but every once in a while, the spike for seemingly no reason. The biggest offender is Dogecoin (DOGE), where during 2021, it pumped every time Elon tweeted about it. As of July, 2023, they are trading near lows at around $0.08/coin.
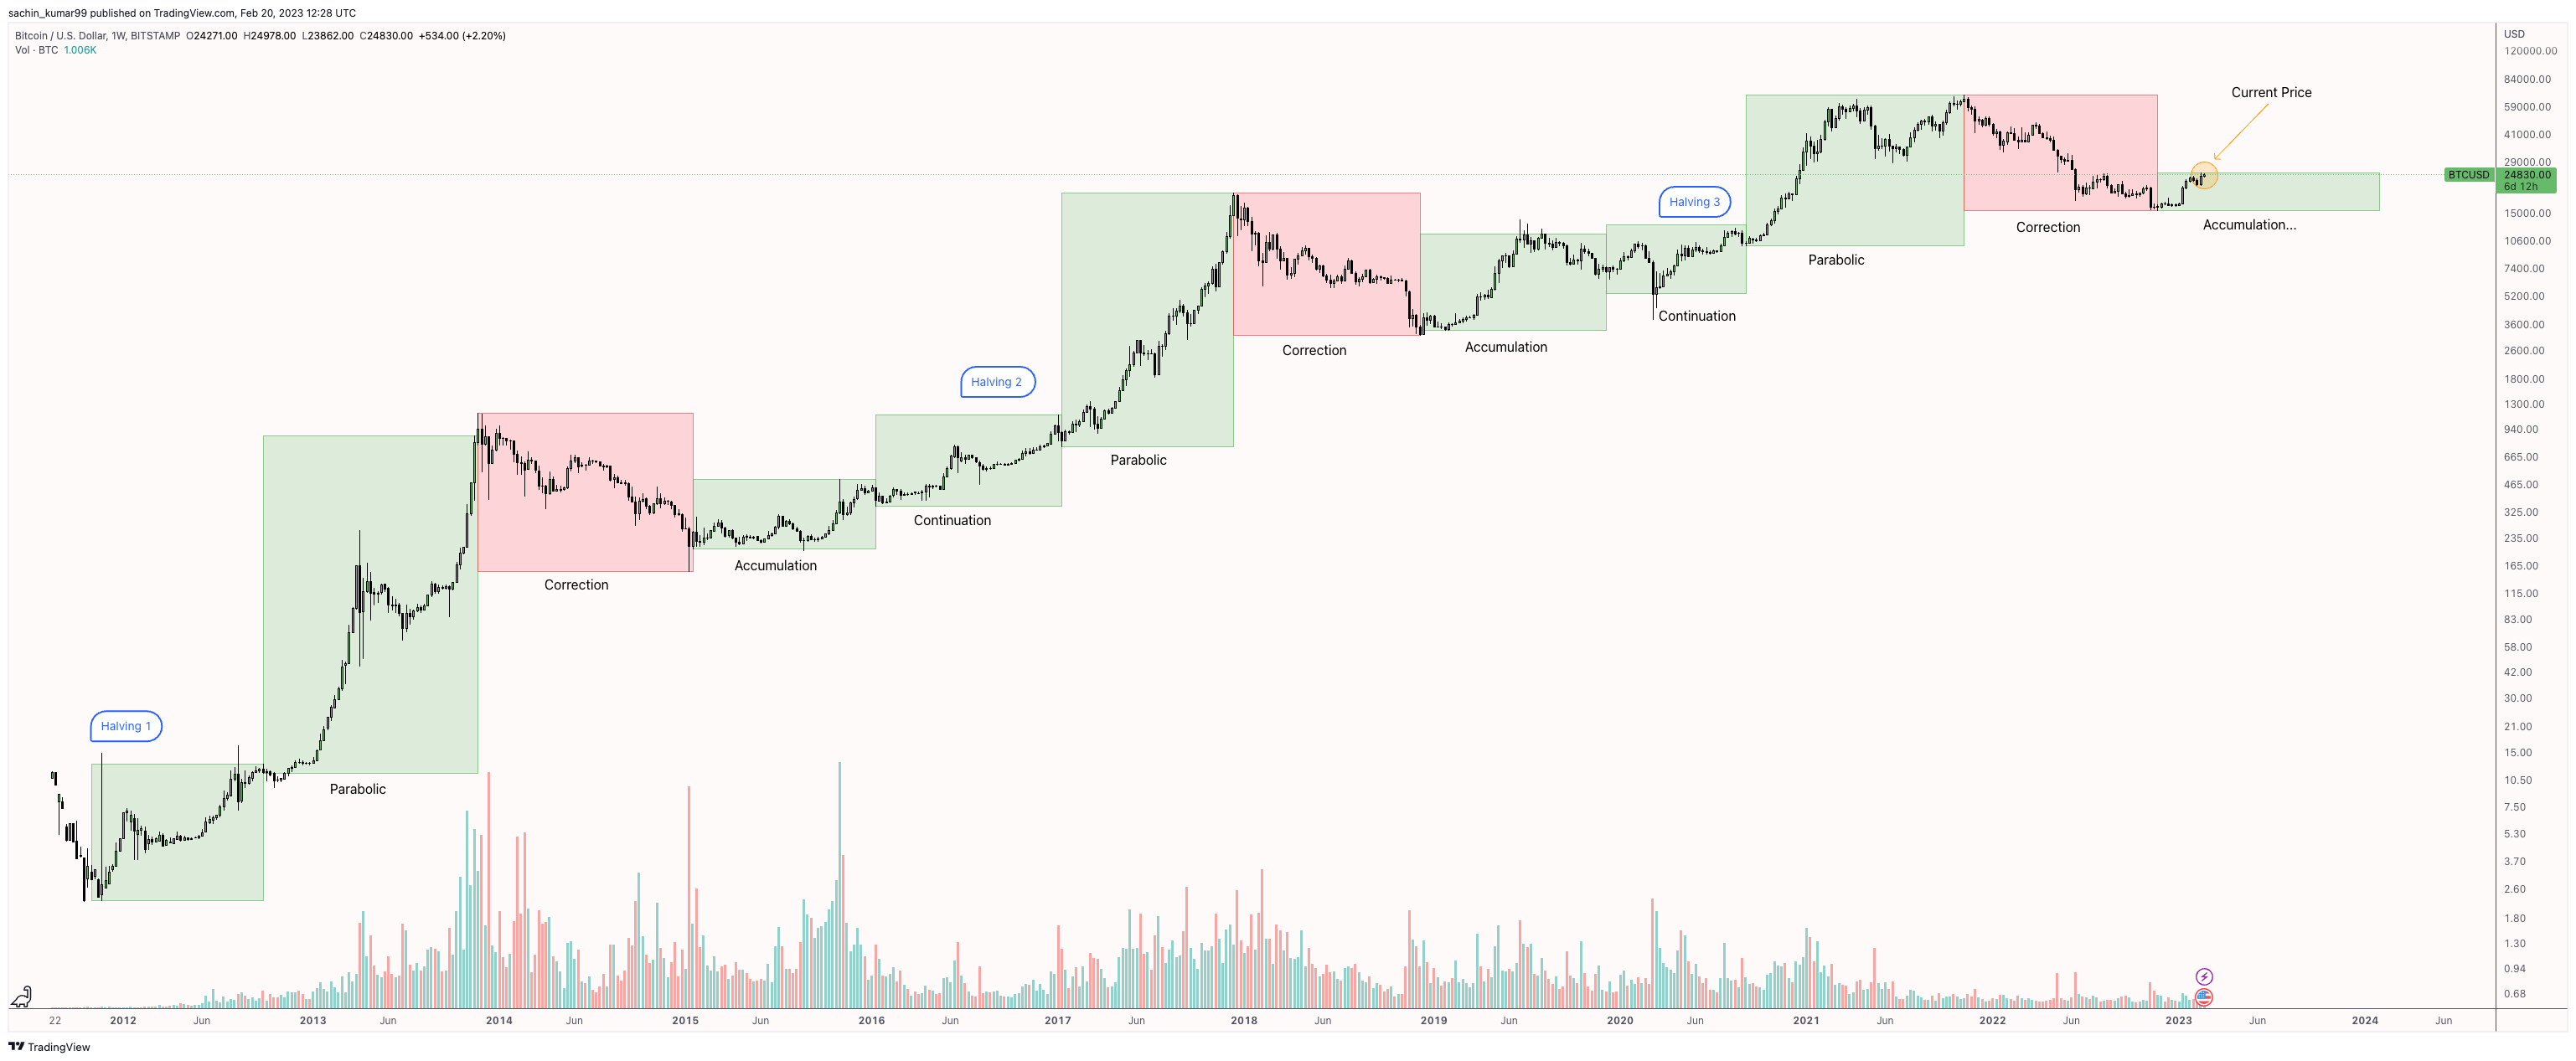
In terms of market movement, on a daily basis, cryptocurrencies act very much like high beta tech stocks. For example, if Apple (AAPL) moves 1% in a day, Bitcoin might move 2%. Etherium might move 4%. Cryptocurrencies are significantly more volatile than stocks, 5% in a day is common and 10% a day is not uncommon. The reason I say that crypto acts like tech stock is that in the short term (days and weeks), it really does have a major correlation with the tech sector and the overall stock market. For example, Jerome Powell’s speeches have the ability to move Bitcoin’s price. However, in the long term (months and years), the crypto market loses its correlation. Instead, it tends to move in cycles of 4 years according to the Bitcoin halving schedule. In the time leading up to and shortly after the Bitcoin halvings, often times the entire crypto space goes parabolic, with Bitcoin leading the charge. Then after Bitcoin tops out (ie. it stays near the top for a few days), we have an altcoin season, where for one or two weeks, Etherium and some altcoins (like ADA, MANA, SOL, etc.) continue to pump before having a spectacular blow-off-top, and we enter a crypto winter.
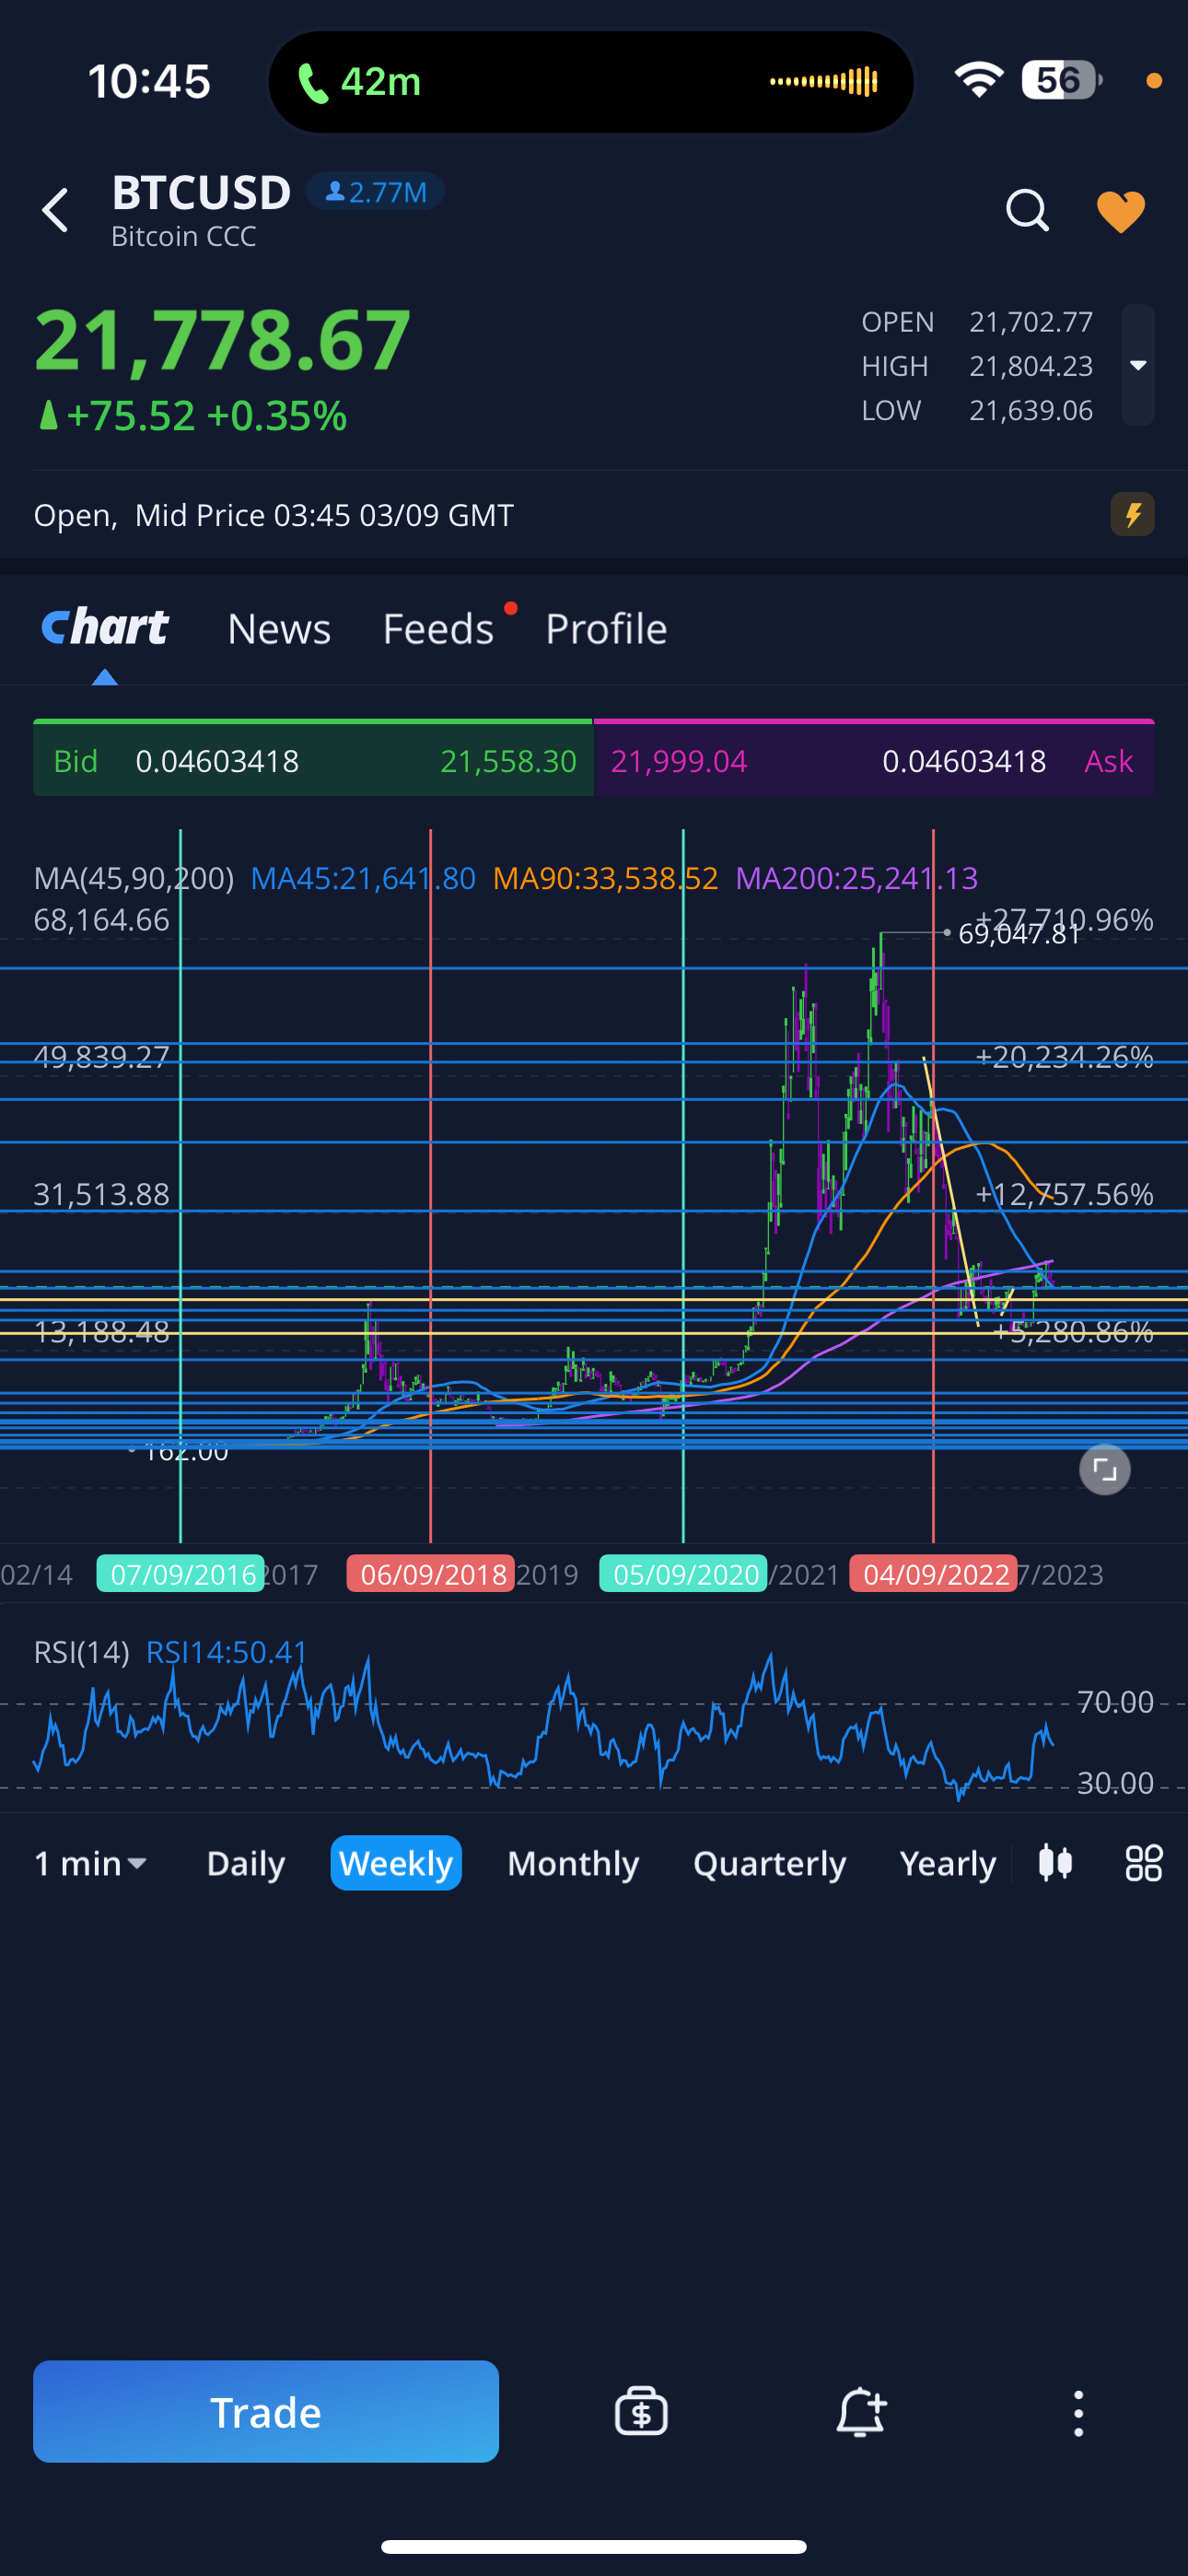
With cryptocurrencies, I recommend investing, not trading it. Since there are no cryptocurrency options, it is difficult to “day trade” them, and because they are so volatile, I do not recommend doing short-term trading on them either. The only rational way to play cryptocurrencies is to nibble at it near where you think the bottom of the crypto winter is going to be, then some time during the insane bull run that ends after the halving, take profits instead of riding it all the way down again. Recently, the bottom seems to have been in January 2023, when Bitcoin was hovering around the $16K range. However, it has since run up with all the other tech stocks alongside the AI hype, and it’s now trading near $30K in July 2023. So if you wanted to invest in Bitcoin, in theory, I personally would wait for it to drop to around $25K or $20K before buying in (although you should do what you want).
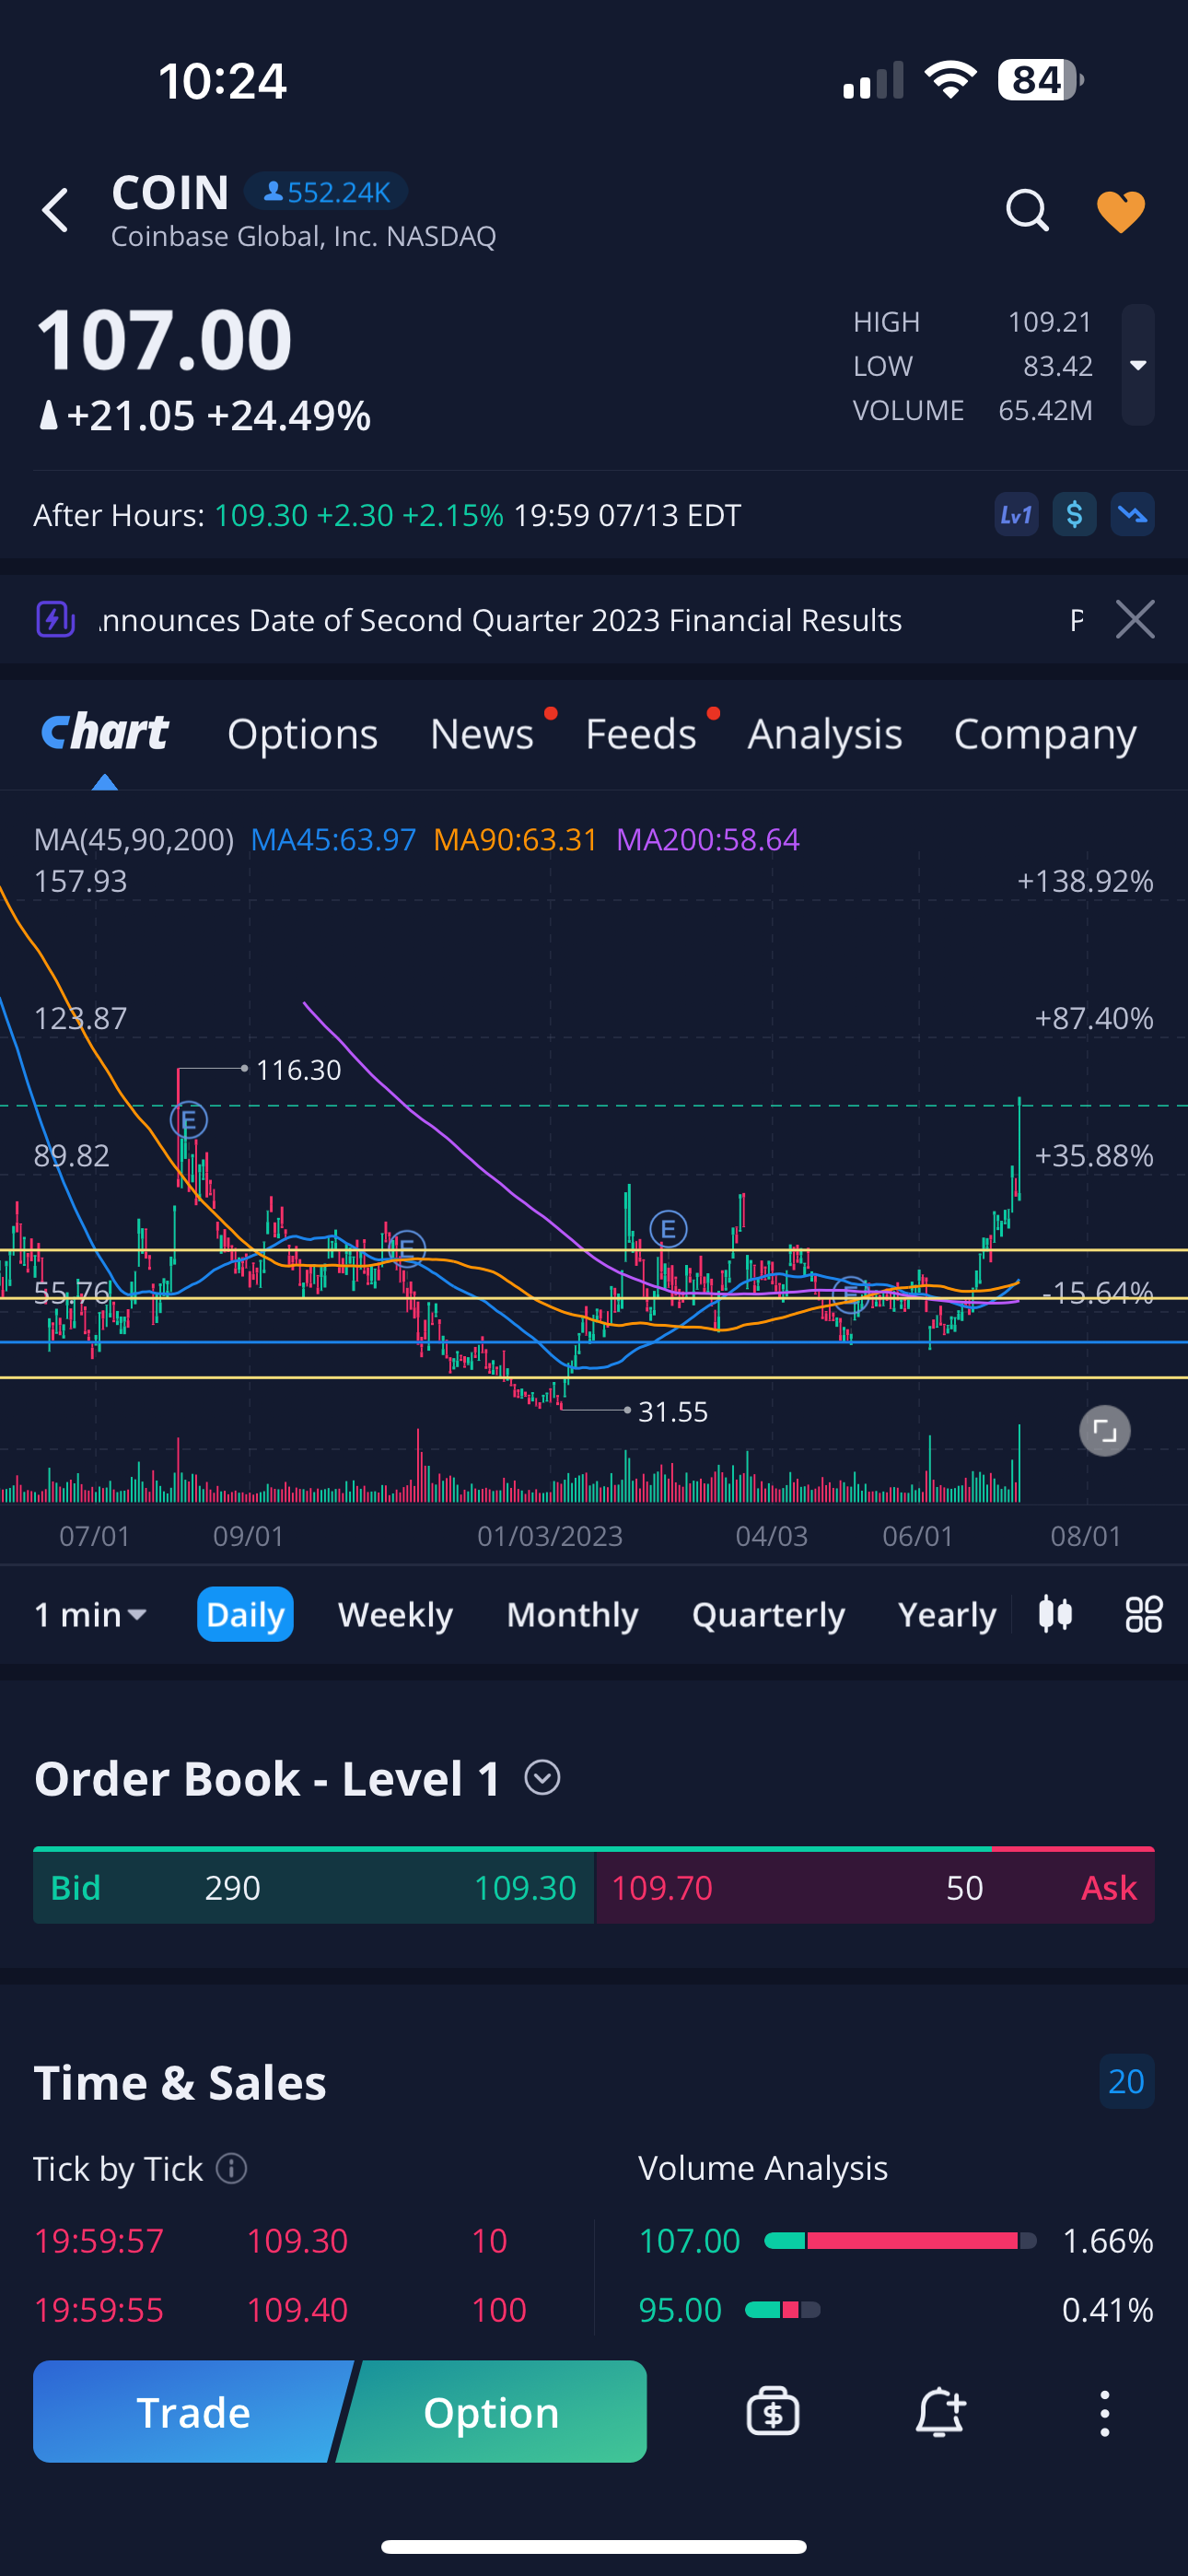
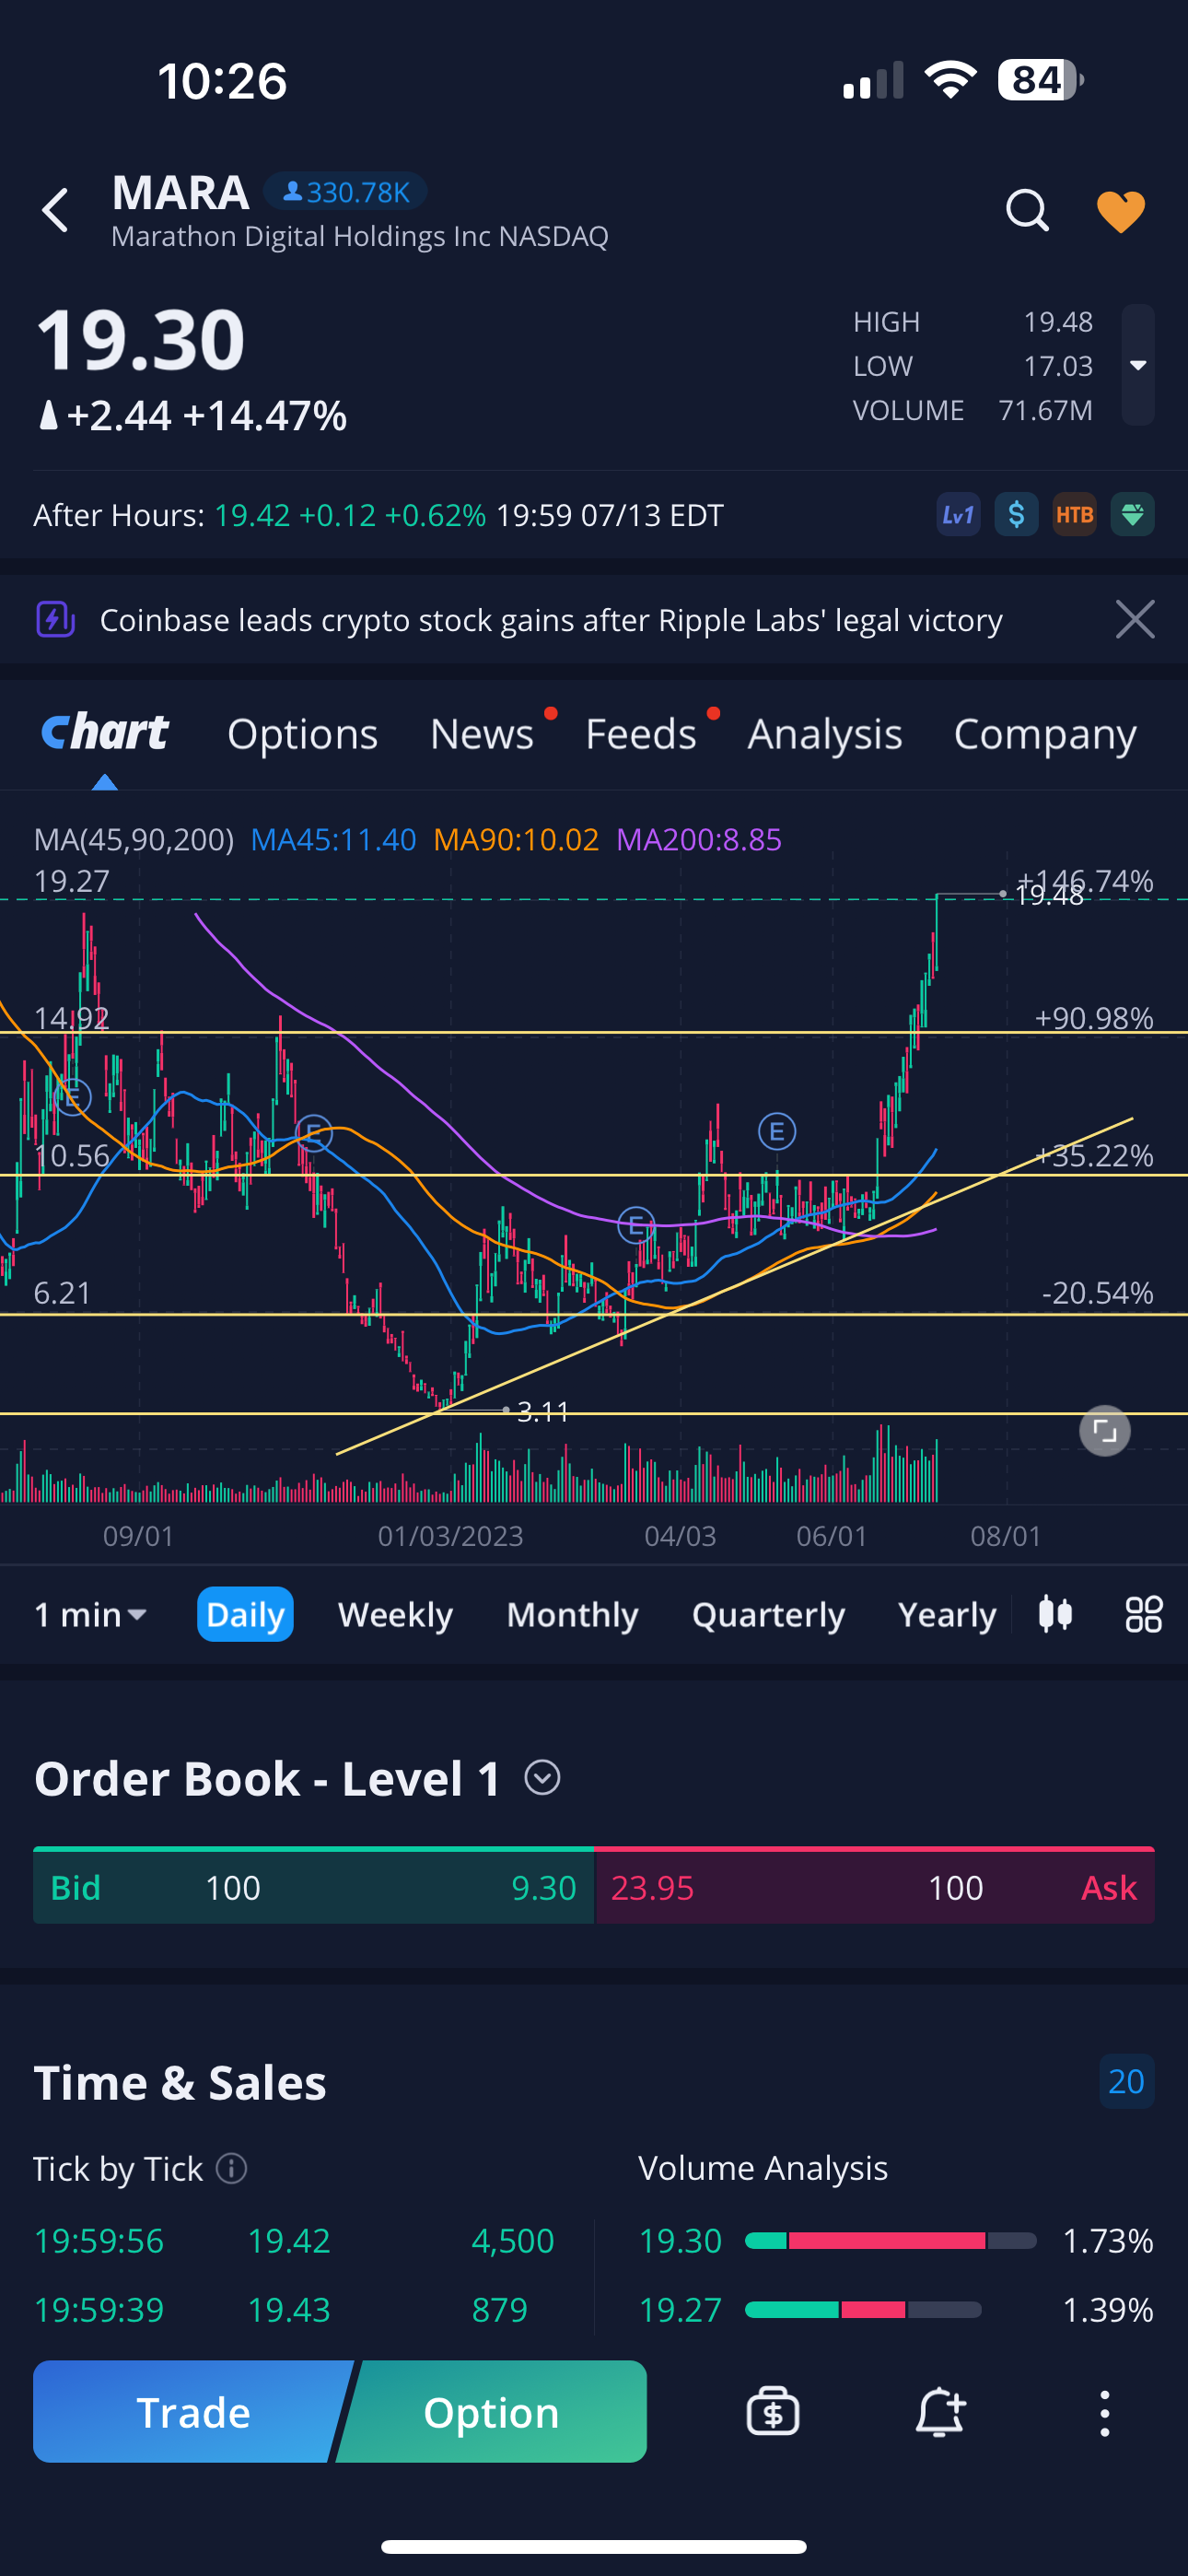
An alternative to buying crypto directly is to invest in the stocks of crypto companies, such as Coinbase, Mara, or Riot. These stocks basically doubled in the last few months due to people perceiving that Bitcoin has re-entered bull market territory.
Options
Options are the most complex of the three asset classes and also the least familiar to most people, so it’s also the one I’m going to delve most into the details.
An options contract is a type of derivative security that controls 100 shares of an underlying asset. Each options contract has a strike price and an expiration date that states that the owner of the option has the “option” to purchase or sell 100 shares of the underlying asset on that specific date. There are two types of options, calls and puts. These are best illustrated with the following specific examples.
Call option example: If I have an AAPL call option with a strike price of $125 that expires on Friday, December 30, 2022, then on that day, I can exercise that option and buy 100 shares of AAPL at $125 from the writer of that option, even if AAPL closed at $130 on that day. In this example, since this is a profitable action for me, the option is said to be in the money. If instead, I had an AAPL call option with a strike price of $135 that expires on Friday, December 30, 2022, and AAPL closed at $130 on that day, then it makes no sense for me to exercise the option. Instead, the option expired worthless because it was out of the money.
Put option example: If I have an AAPL put option with a strike price of $135 that expires on Friday, December 30, 2022, then on that day, I can exercise that option and sell 100 shares of AAPL at $135 from the writer of that option, even if AAPL closed at $130 on that day. In this example, since this is a profitable action for me, the option is said to be in the money. If instead, I had an AAPL put option with a strike price of $125 that expires on Friday, December 30, 2022, and AAPL closed at $130 on that day, then it makes no sense for me to exercise the option. Instead, the option expired worthless because it was out of the money.
In these examples, we assumed that at least one of the parties had 100 shares of the underying asset. For example, you can exercise your option and purchase 100 shares of AAPL from someone. However, in practice, you don’t need to do this, because you can trade naked options, that is, options that aren’t backed up by the security. Just make sure you get rid of it before the expiration date and it doesn’t expire in-the-money, and you’re good. However, if you are the seller (or writer) of an options contract, especially if you’re in a cash account, you will need to cover your option with cash or stocks.
If you found the options examples complicated, don’t worry. The most important thing about options are how they move in relation to the underlying asset. In general, call options move in the same direction as the underlying asset and put options move opposite to the underlying asset. In other words, if the price of the underlying asset increases, the call option will increase too, and the put option will fall. If the price of the underlying asset falls, the put option will increase, and the call option will fall. (Note: there are many times when this doesn’t necessarily happen, but we’ll cover that later.)
Options get their value from dynamic pricing according to the Black-Scholes Model, because high-frequency traders (HFTs) will trade options rapidly to keep the pricing of the options around the value predicted by that model, especially for large cap companies (note: this isn’t true for small caps). Options have two components to their value: intrinsic and extrinsic value. The intrinsic value is how much the option is worth if you were to exercise it right now. In the call option example above, if the AAPL call option has a strike price of $125 and AAPL is currently worth $130, then the intrinsic value is $500, because the current market value is $5 above the strike price and each option controls 100 shares. (Note: Actually, it doesn’t work EXACTLY like I described, but I think this is an explanation that makes the most sense to most people. If you’re interested in how option prices are truly computed, search for Black-Scholes Model on Google.) The extrinsic value is the value of how much risk the option writer wants to take on by holding the option instead of just owning the underlying asset. For example, suppose today is Monday, December 26, 2022, and your option expires Friday, December 30, 2022. There are 5 days to expiration, or 5DTE. During these 5 days, the price of AAPL could move. If it drops below $125 during this time, this option would expire worthless. So nobody is going to sell you the option just for the intrinsic value, they want some overhead in return. That’s the extrinsic value. Extrinsic value goes down as the option approaches expiration. This is known as theta decay, or time decay. Sometimes, extrinsic value goes up in response to implied volatility, or the amount people think a stock could move during an important event, such as earnings calls. For example, in October 2022, META had an earnings call where their share value went off a cliff. The implied volatility leading up to the earnings call drove options prices up: both calls and puts.
Although the above explanation may sound complicated, it’s simply boiled down to this. In general, a near-the-money option moves about $100 for every $1 move of the underlying asset, because it controls 100 shares. The further in-the-money the option is, the more expensive it is. Likewise, the further out-of-the-money the option is, the cheaper it is. Although out-of-the-money options are cheaper, which is an advantage, there is a drawback. The further out of the money you are, the less the option value changes with the stock For example, if AAPL is trading at $130, but your call option has a strike price of $131, it might move $100 if AAPL moves to $131 or $129, but if your call option has a strike price of $140, AAPL moving up to $131 might only increase the price of your option by $5. So there’s a balance. In general, buying 1DTE options or 2DTE options work great for day trading. 0DTE options are cheaper, but they could be dangerous, because the theta decay on 0DTE is extremely steep and less forgiving.
Options are great, because options allow you to make money regardless of what the market is doing, as long as you are right about the market direction. Options also give you leverage, because they control 100 shares, and they are significantly cheaper than outright purchasing or shorting 100 shares of the underlying asset. For example, actually purchaing 100 shares of Apple at $140 per share will cost $14,000, which most people will not have or use in a single transaction, whereas a 1DTE Apple option might only cost $50-$100. Finally, options allow you to limit risk, because you can never lose more than the option is worth. This is in contrast to shorting a stock, where if the stock price squeezes to 10x the price you sold it for, you will lose more than your initial investment trying to buy it back to close your position when you get margin called by your brokerage.
Trading Styles and Methodologies
What are the different ways to play the game? I will briefly cover the top six trading styles here.
Investing with Stocks
This is Warren Buffet’s strategy. You buy the stock of a company that you believe in, then plan to hold this stock basically forever. This is the essence of investing. There is no exit strategy, owning the shares is the end-goal of this strategy. Note that this works if your favorite companies are at DEEP discounts. But if they’re not, and you go all in, you run the risk of losing money in the unforeseeable future. Note that most people do not have the ability to determine the relevant companies of the future like Warren Buffet, and there is some sort of survivorship bias here. Chances are that you’re not the next Warren Buffet, and your portfolio performs similar to the overall market during the time it’s in the market.
Some people believe that in order to prevent losing money by missing the bottom, instead of going all in at the deep discount, you should simply dollar-cost average in, or DCA in. Just keep buying the SPY or AAPL on a regular schedule, no one has ever lost money in a 20-year period in the market, right? As we just came out of two bear markets in recent memory, this is a strategy I can’t recommend. You don’t know that the dip won’t get dippier, and unless you have wills of steel, it will hurt you to open your portfolio and can’t help but wonder if you made the right choice.
So my advice for this strategy is a hybrid approach. First, determine the stocks you’d like to own, and figure out how much of each stock you’d like to own. For example, if you only have $10K, here’s an example of how I would break it down.
| Stock | Risk Level | Allocation |
|---|---|---|
| Apple (AAPL) | Safe | $3000 |
| Amazon (AMZN) | Safe | $2000 |
| Costco (COST) | Safe | $2000 |
| AirBnB (ABNB) | Medium | $1000 |
| Facebook (META) | Medium | $1000 |
| Chargepoint (CHPT) | Risky | $500 |
| Lucid Motors (LCID) | Risky | $500 |
Disclaimer: These are just some stocks that I like, I am not making any stock recommendations with this list, these are just examples.
Next, for each allocation, split your money into four equal parts. For example, if you’ve allocated $3000 to buying AAPL, 1/4th of that is $750. First, be patient. If you think AAPL is a steal at $125, buy 6 shares. Suppose for some reason, AAPL continues to dip, and it falls to $110, buy 7 shares. If it continues to fall, then you will still have half the capital you allocated to buy more. If it goes up, and you truly believe that AAPL has bottomed, at that point, you can deploy the next 1/4th of your capital, and finally the last when you are absolutely certain. One thing about this strategy is that you should ignore the “net worth” of your account completely, because it is irrelevant. You bought because YOU like the stock, and YOU thought it was at fair value. If the market doesn’t agree, you still like the stock, and you still thought it was at fair value. If you change your mind just because the stock went down in value, then this strategy is not for you.
Notice that in my list, I categorized the stocks according to risk levels of safe, medium, and risky, with the largest allocations to the safe categories. Also notice that I don’t recommend simply buying index funds, because if you do, you’re not betting on companies you like, rather, you’re simply betting that the market overall will go up due to macroeconomic conditions that are based on what Jerome Powell or the current US Fed Chair says next.
As for cashing out, you do it far in the future, for example, when you retire. For that reason, I recommend this strategy only in your retirement account, such as a 401K or IRA to make it less likely that you would sell it at a loss because you need the cash, because micromanaging a strategy like this dooms it to failure. Of course, if you are building your retirement account, you could always add more money, so your allocations may change, but I’d recommend keeping the same overall percentages unless you have some reason to change them. I’d also recommend only picking a handful of companies that you believe and understand. I think it is a mistake to buy 100 different stocks for your portfolio, because it prevents you from keeping a vested interest in all of them. Remember that Warren Buffet’s success is not due to the SPY or other index funds, it is because he truly believes in the companies he buys and plans to hold forever.
By the way, if you’d like to read more on this style of investing in the market, I highly recommend Buffetology, by Buffet (NOT Warren Buffet). It was written by his daughter-in-law, and it captures his thinking well.
Swing Trading with Stocks
Swing trading is the act of buying a stock, holding it overnight, and selling it days, weeks, or months later. Swing trading is distinguished from day trading, a strategy in which you buy and sell the same asset within the same day. Why is it important to hold overnight? There are numerous studies that show that the majority of the stock market movement happens in pre-market and after-hours trading. Between 8 pm EST and 4 am EST, the market can gap up or down significantly, and this paper shows how market-hour movements average to 0 in the long-term.
The primary advantage of swing trading is that if you have a full-time job, this style of trading takes the least amount of time, just a couple minutes throughout the day, and you can go on with your job without having to stare at the screen. Just make sure you get a good entry, set a stop loss, and go about your day, buying in near support and selling near resistance. Rinse and repeat.
Another advantage of swing trading is that it tends to be a lot more predictable compared to the seemingly random fluctuations during market hours. However, the drawback is that you are risking your capital overnight, meaning you could wake up with less money than you went to sleep with if you are wrong. If the market gaps down significantly overnight, it could ruin your day when you wake up. So with swing trading, it is also important to pay attention to the news. Know when the FOMC meetings are, when CPI or PPI numbers are being released, when inflation data is being released, when members of the Federal Reserve are speaking, etc. so that you aren’t surprised when there is a significant market event that tanks your portfolio. Also be cognizant of the dates of the earnings reports of the companies you invest in, as these tend to cause the stock price to move much more than usual.
As a quick example for how to swing trade, say that you allocated $1000 to spend on AAPL. AAPL is trading at $160, but based on your charting, you have determined there is an uptrending support line that AAPL will touch when it hits $150, so that will be your entry point. After a few days, it indeed hits that support. At this point, buy half of our allocation, or 3 shares. At this point, determine where you’re going to set your stop loss or take profit. For example, say you want to take profits when AAPL reaches $180 and set your stop loss at $145. This means you’re risking $5 a share to potentially gain $30. Suppose you were correct, and AAPL actually goes up to $180. At this point, since you have three shares, you can decide to sell two and keep one, just in case AAPL continues to go higher. In this example, you made $60, just by getting a proper entry and being patient.
So why did I recommend only going in with half your allocation? Suppose instead, the market negated your hypothesis, and AAPL continued to fall, but because you weren’t paying attention, you forgot to execute your stop loss. You determined your second entry is going to be at $125. After a few weeks, AAPL indeed falls to $125. Now since you didn’t go all in, you still have $450 of cash to get into your new position, so you can buy 3 more shares. Then, over the next few days, AAPL goes back up to $150. Now since you have a total of 6 shares, you can sell 3 of them to replenish your cash, and you would have made a total of $75 while keeping your original three shares.
Notice in these examples that it’s of utmost importance to replenish your cash. You very rarely want to be fully invested, just in case some shenanigans happens.
Day Trading with Options
Day trading is the act of buying and selling the same asset within the same day. Why is it so important to close your position within the same day with this style of trading? At market close at 4 pm EST each day, you hold on to the exact amount of cash in your account. You will not wake up to potential losses or need to worry about what the market does when you go to sleep. Furthermore, only in day trading do you you have the potential to make enough money to actually live off of. Very few people make it in day trading, but the few that do can boast a very high income by making a few thousand dollars a day.
The most important aspect of day trading is making sure that you are not overtrading. Day trading is most akin to fishing. You are waiting for the right setup to come along, and you ONLY trade if you see that setup. Many beginners (including myself) tend to overtrade due to time limitations or psychology, but the most successful day traders try to only make at most 3 good trades a DAY. Sometimes, if they don’t see the setup that they like, they don’t trade at all.
Jimmy from TradingDecoded is a really accomplished day trader, and his YouTube videos paired with practice on TradingTerminal’s Trading Replay App will be your best bet on learning how to day trade correctly and developing your own entry/exit strategies. I recommend learning how to day trade by using SPY single-leg options, as it will have the most liquidity. AAPL is a close second, if you don’t like how random SPY can be. Just like with swing trading, the concept of risk/reward ratio is of utmost importance.
Buy the Rumor, Sell the News
There are many instances of this, the most famous being Dogecoin. In 2021, Elon Musk constantly tweeted pictures of Shiba Inu dogs and artificialy pumped up the price of Dogecoin. Every time he would tweet, Dogecoin would go up. In May, 2021, he was scheduled to be on a Saturday Night Live, where it was largely speculated that he will encourage people to buy Dogecoin as part of his skit. As a result, Dogecoin went from $0.30/coin to $0.75/coin. I watched this pretty closely: 15 minutes into the SNL skit, as soon as Elon said his one-liner about Dogecoin, it started dumping HARD. You barely had enough time to get out. Everyone who sold during that time made money, and if you had waited a day, you would have lost over $0.20/coin. Obviously, for this to happen, there were people buying the top. So the proper way to play this would have been to buy while it was still going up, knowing that it will be likely to go up until the news event (the SNL skit), and then an hour or a day before the skit, take profits in the $0.65-$0.75/coin range.
Short Squeezes and Meme Stocks
This is a more extreme version of buy the rumor, sell the news, and the quintessential example of this is GameStop short-squeeze of early 2021. Usually, these are very volatile. If you caught wind of this before it reached the mainstream media, you can make a lot of money. But usually, the moments when you are profitable will be very fleeting: by the time you have heard of it in the news, it would have already been too late to get in, and you will have a bad risk/reward ratio.
Earnings Plays with Options
This is an advanced strategy and something I wouldn’t recommend until you have seen a few of these play out. Earnings seasons come every three months, and typically, the large companies report first, followed by smaller companies, and they almost always report in the same order. For example, big banks usually report the first week of earnings, followed by the tech giants, then airline companies, then smaller companies. A good source of information revolving around earnings can be found on EarningsWhispers. This is usually posted on their Twitter page, but given the recent shenanigans with Twitter after Elon Musk acquired it, recently it’s been easier to just Google “EarningsWhispers Most Anticipated” and looking for the infographic there.
There are two ways to play this.
- The more straightforward way is to buy an option based on the direction you think the stock will trade. For example, if you think the stock will skyrocket following earnings, then buy a call. If instead you think it will drop off a cliff, then buy a put. If you don’t think the stock will move more than 2-4%, then sit it out. The advantage of this strategy is that your risk is limited, because you can only ever lose as much as your option contract is worth. However, this method also has a lower probability of success, because not only dodes the stock have to move in your direction, the move has to be sufficiently large, or you will lose money due to something know as “IV crush.” Basically, in the time leading up to an earnings event, the implied volatility increases dramatically, and this adds to the premium of the contract. All options become more expensive, because due to the uncertainty surrounding the event, it becomes riskier to hold onto the option.
- The less straightfoward way is instead of buying an option, you sell it. For example, if you think the stock will skyrocket following earnings, then sell a put option. If instead you think the stock will drop off a cliff, then sell a call. The advantage of this strategy is that you are more likely to make money, because most options contracts lose value following earnings due to the IV crush. When you sell an options contract you don’t have, you are the options contract writer You get paid upfront by the buyer of the options contract. Of course, on the other side of the trade, the person who purchased the options contract from you is hoping that you are wrong. If you are right, for example, say that you sell a call and Meta drops off a cliff, now the options will be even further out-of-the-money, and you pocket the entire cost of the option. However, if you are wrong, this can go terribly wrong, because then you will have to deal with assignment, and in this scenario, your risk is NOT limited. For example, say META is trading at $150, as it was on February 2, 2023, and you sell a call option with a strike price of $175. Overnight, META skyrockets and goes to $185. Now as the writer of the options contract, you are on the hook: when the buyer/owner of the contract exercises that call option at expiration, they will be purchasing those shares from you. So your brokerage will force you to purchase those 100 shares of META on the open market for $185 to sell to the owner of the options contract (ie. the person on the other side of the trade from you) at the strike price of $175. In practice, you won’t see these transactions, you will simply see that the option has been exercised, and you owe the brokerage $1000 for the difference. That is going to be a LOT more than you got by selling the option, so your risk was undefined. Nonetheless, because this is a higher probability setup, most traders still prefer this strategy, because the idea is that you would have reaped in a lot more rewards that you can cover for that off chance that you get assigned.
Example Trades
In this final section, I wanted to share some of the successful trades I have made last year to hopefully demonstrate that it is possible to make good money with the stock market so long as you find the strategy that best suited for you. Your mileage may vary, and everyone is different.
Swing Trading with Stocks
Throughout Summer 2023, I was watching NVTA, noticing that every time it hit support at around $1.05, it would rise dramatically up to around $1.50, then fall pretty dramatically just as quickly. So when NVTA hovered around $1.10, I entered my 200 share position and waited (200xNVTA@1.10).
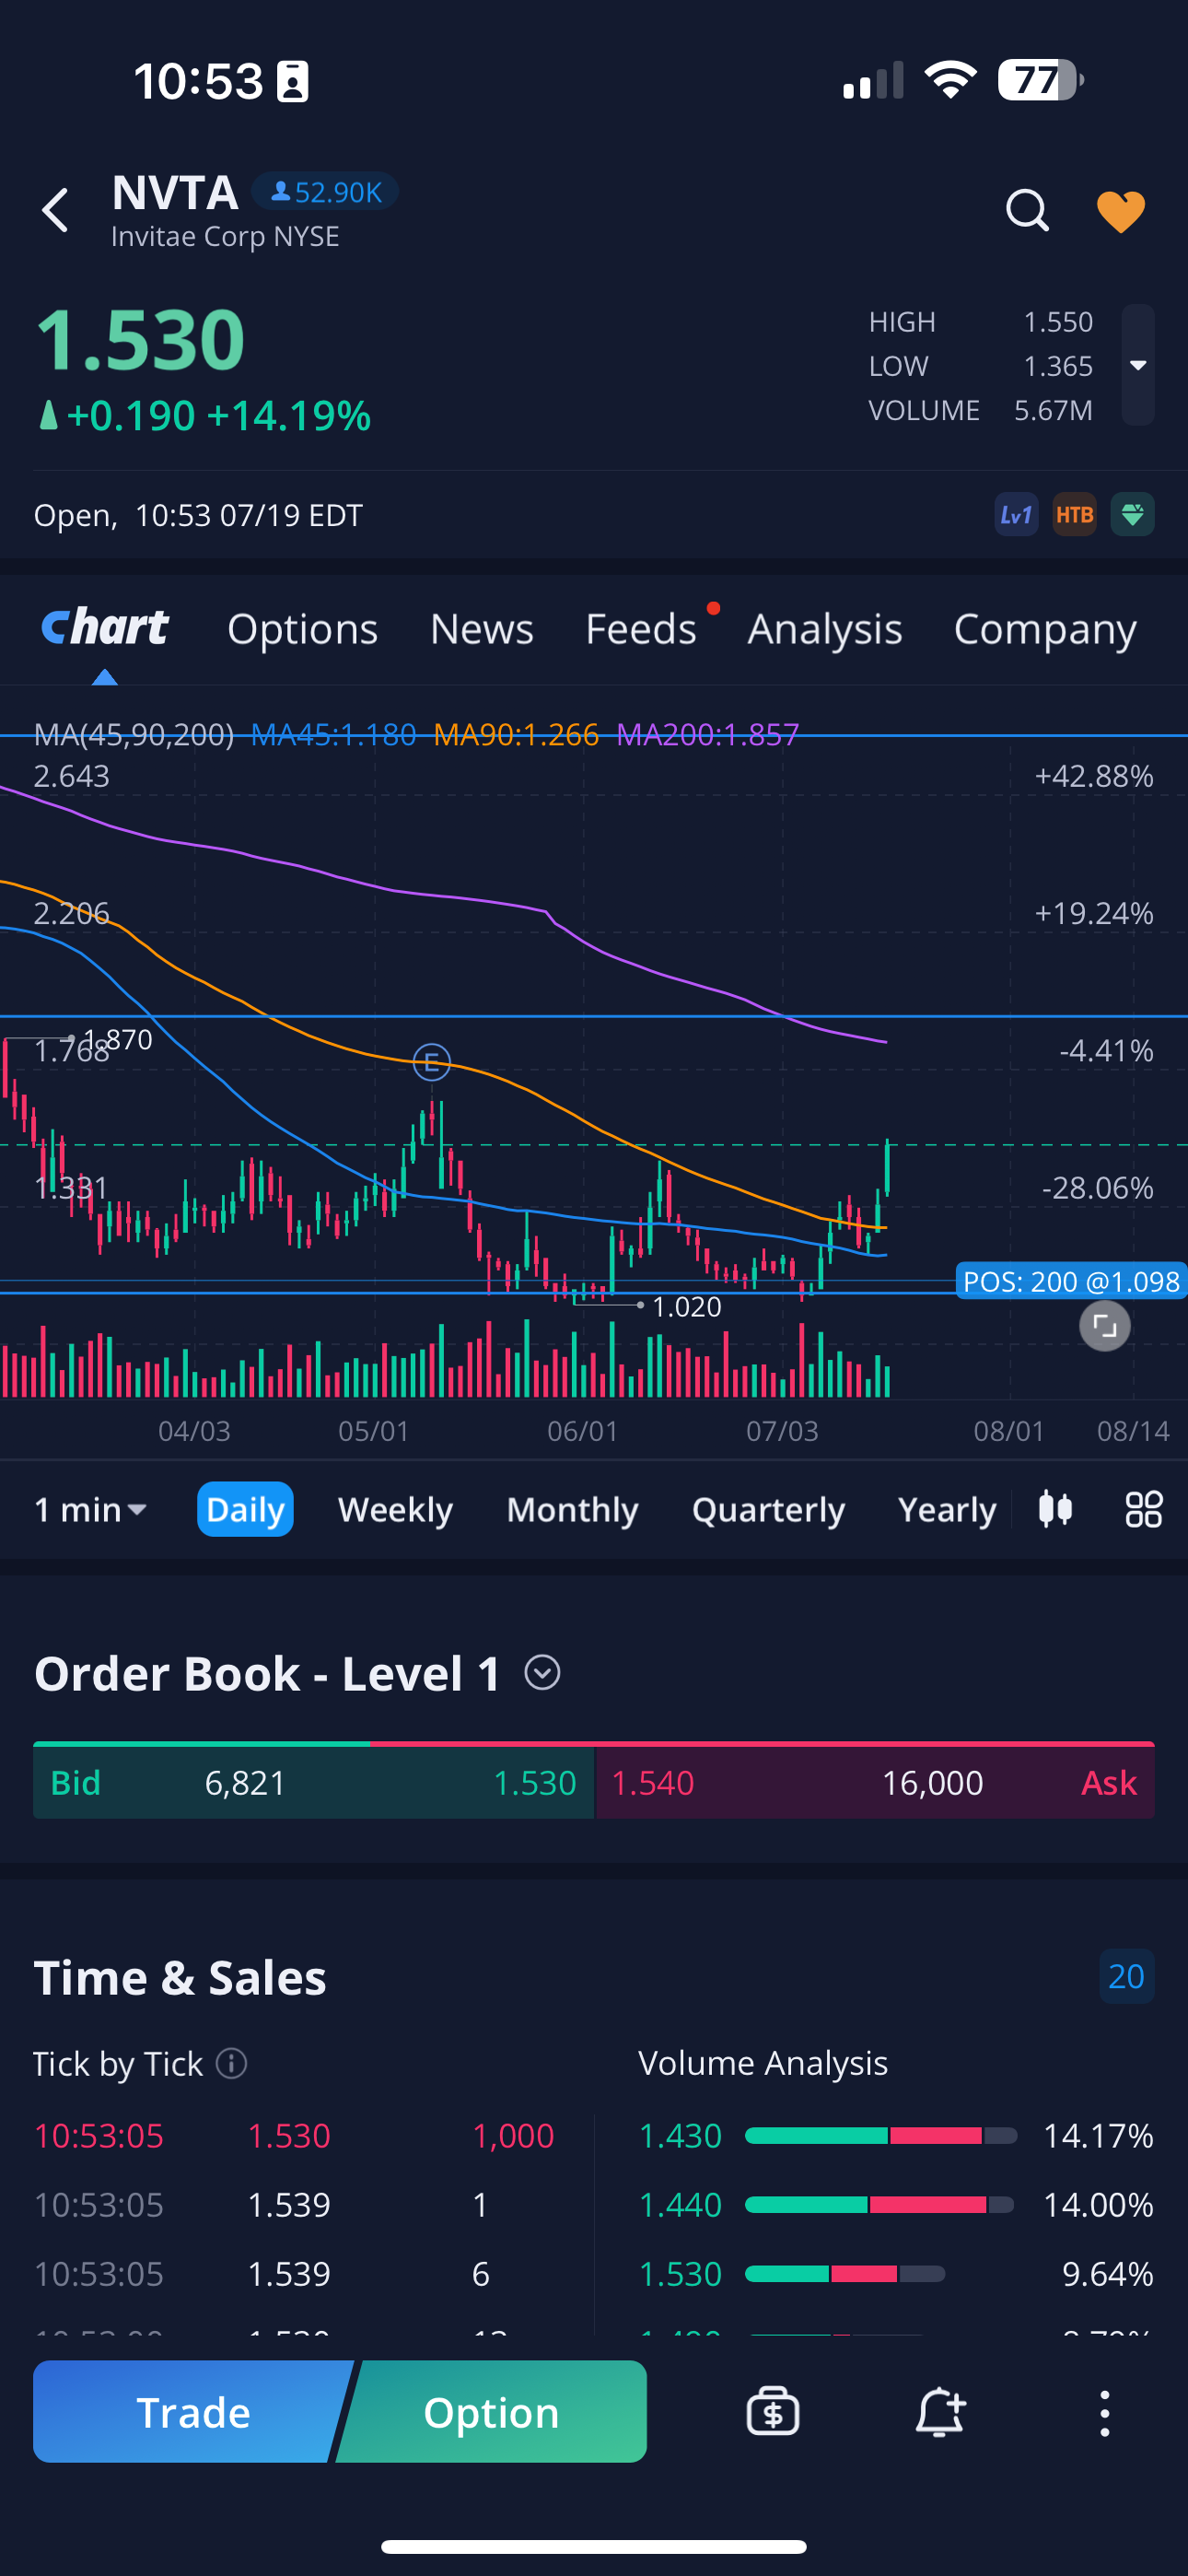
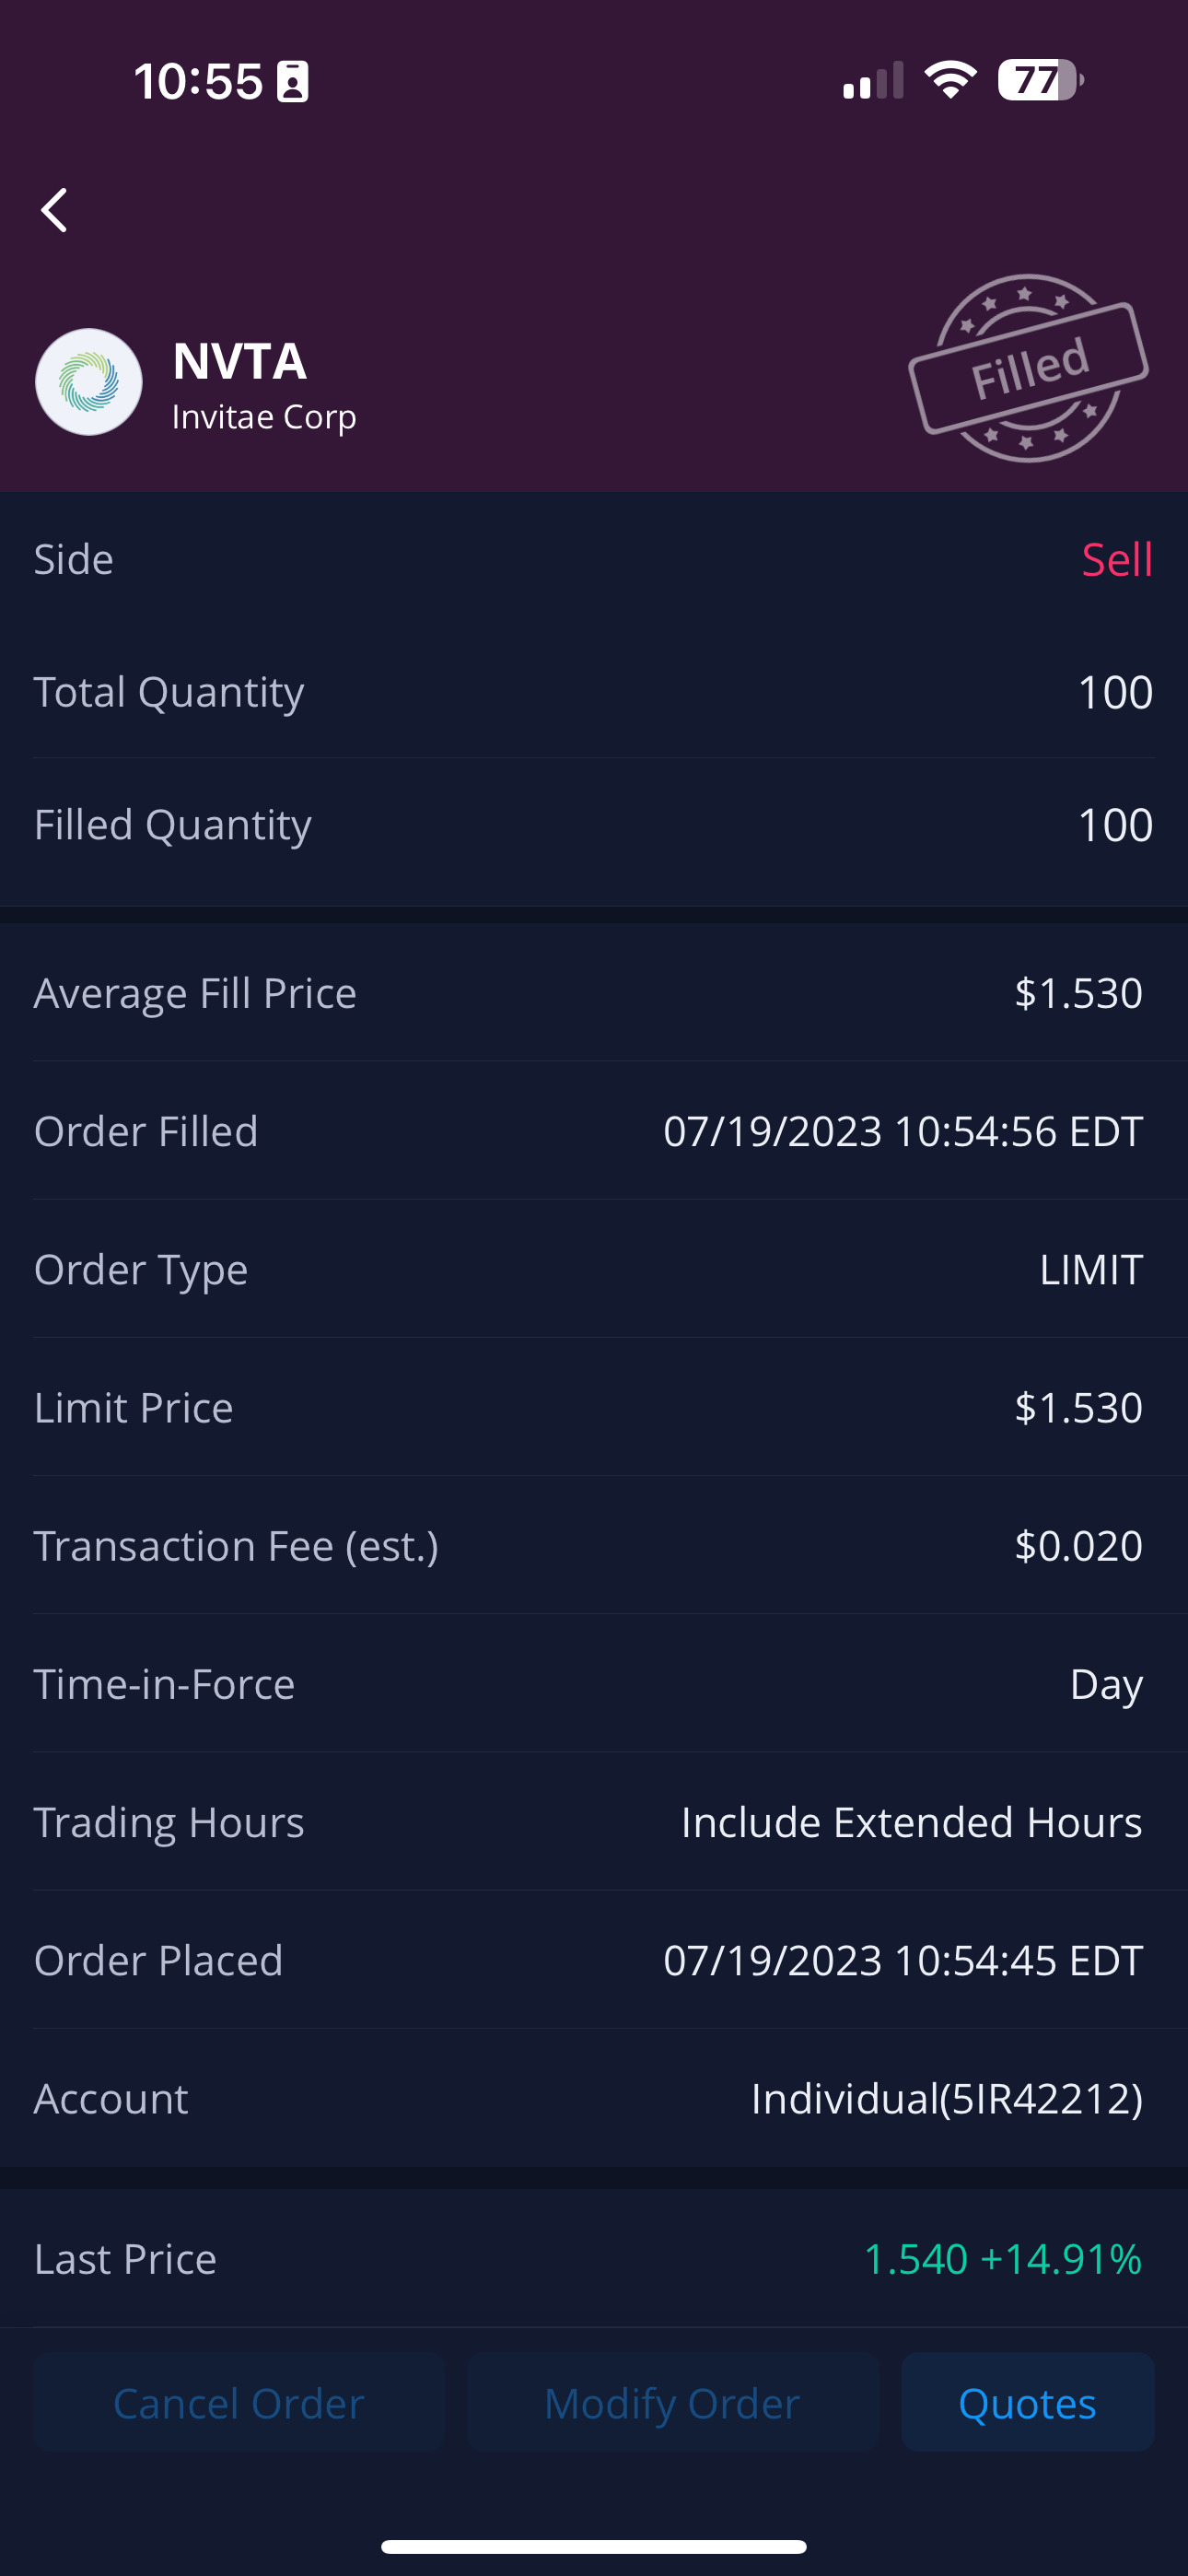
After about a week and a half, NVTA indeed spiked up, and I sold 100 shares at $1.53 each (100xNVTA@1.53).
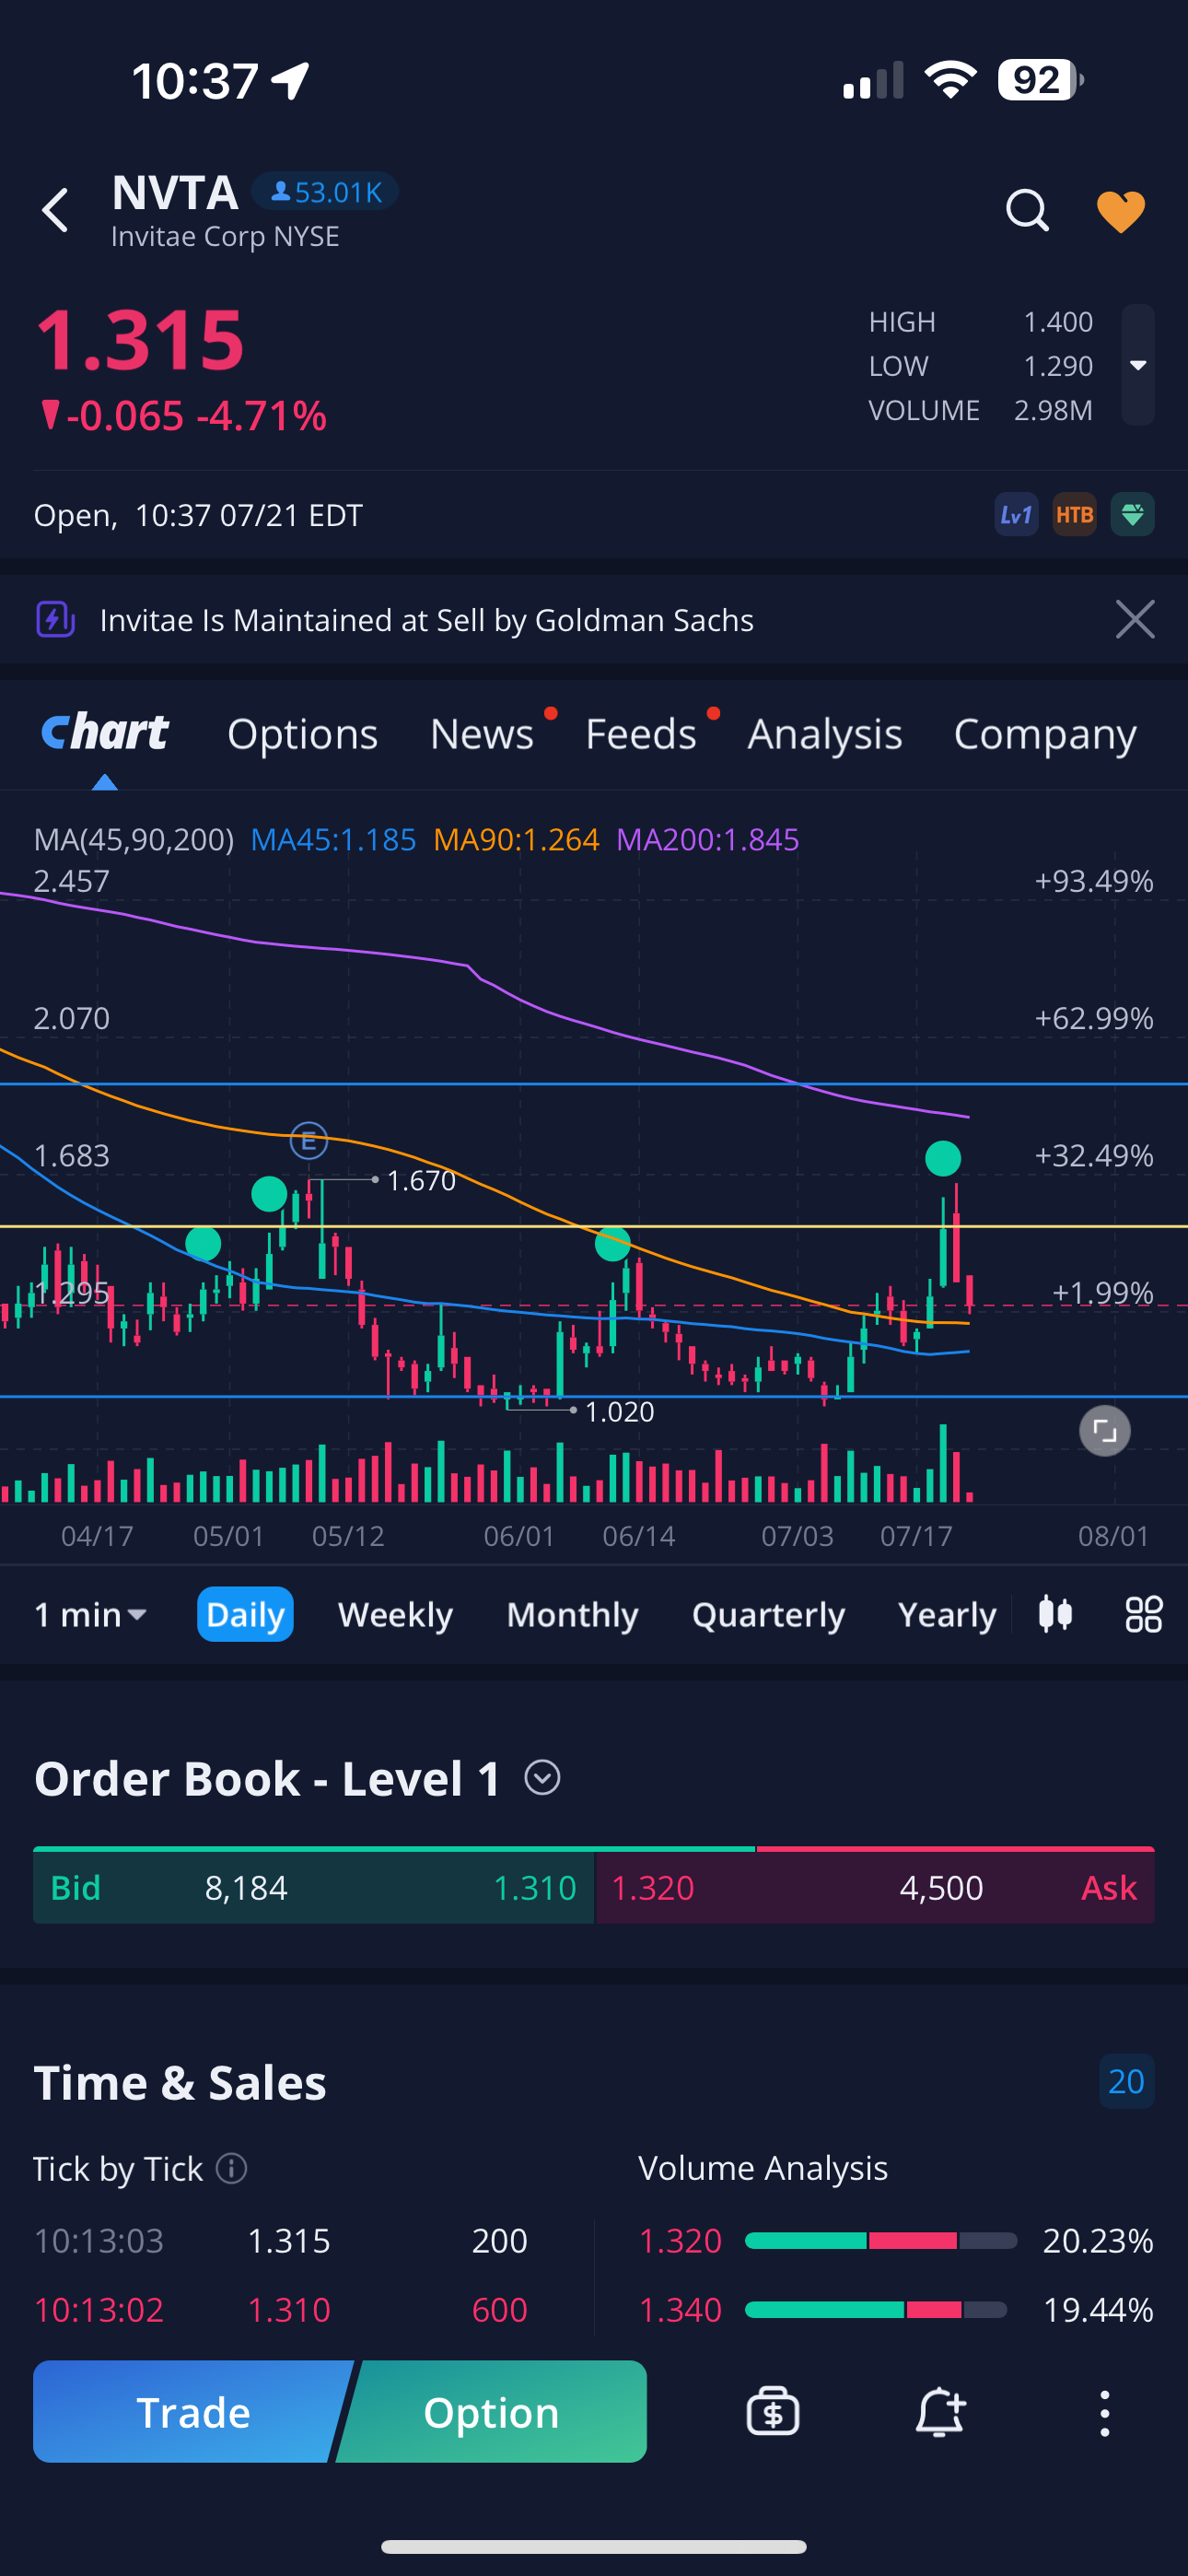
The next day, it went higher to $1.65 at open, but I missed the top, which only lasted a couple of minutes. I sold the other 100 shares at $1.47 (100xNVTA@147). These trades neetted me a total of $80 for a low amount of effort. The move was extremely fleeting, but I captured most of it. The fact that it fell confirmed to me that taking profit at that point in time was the right move.
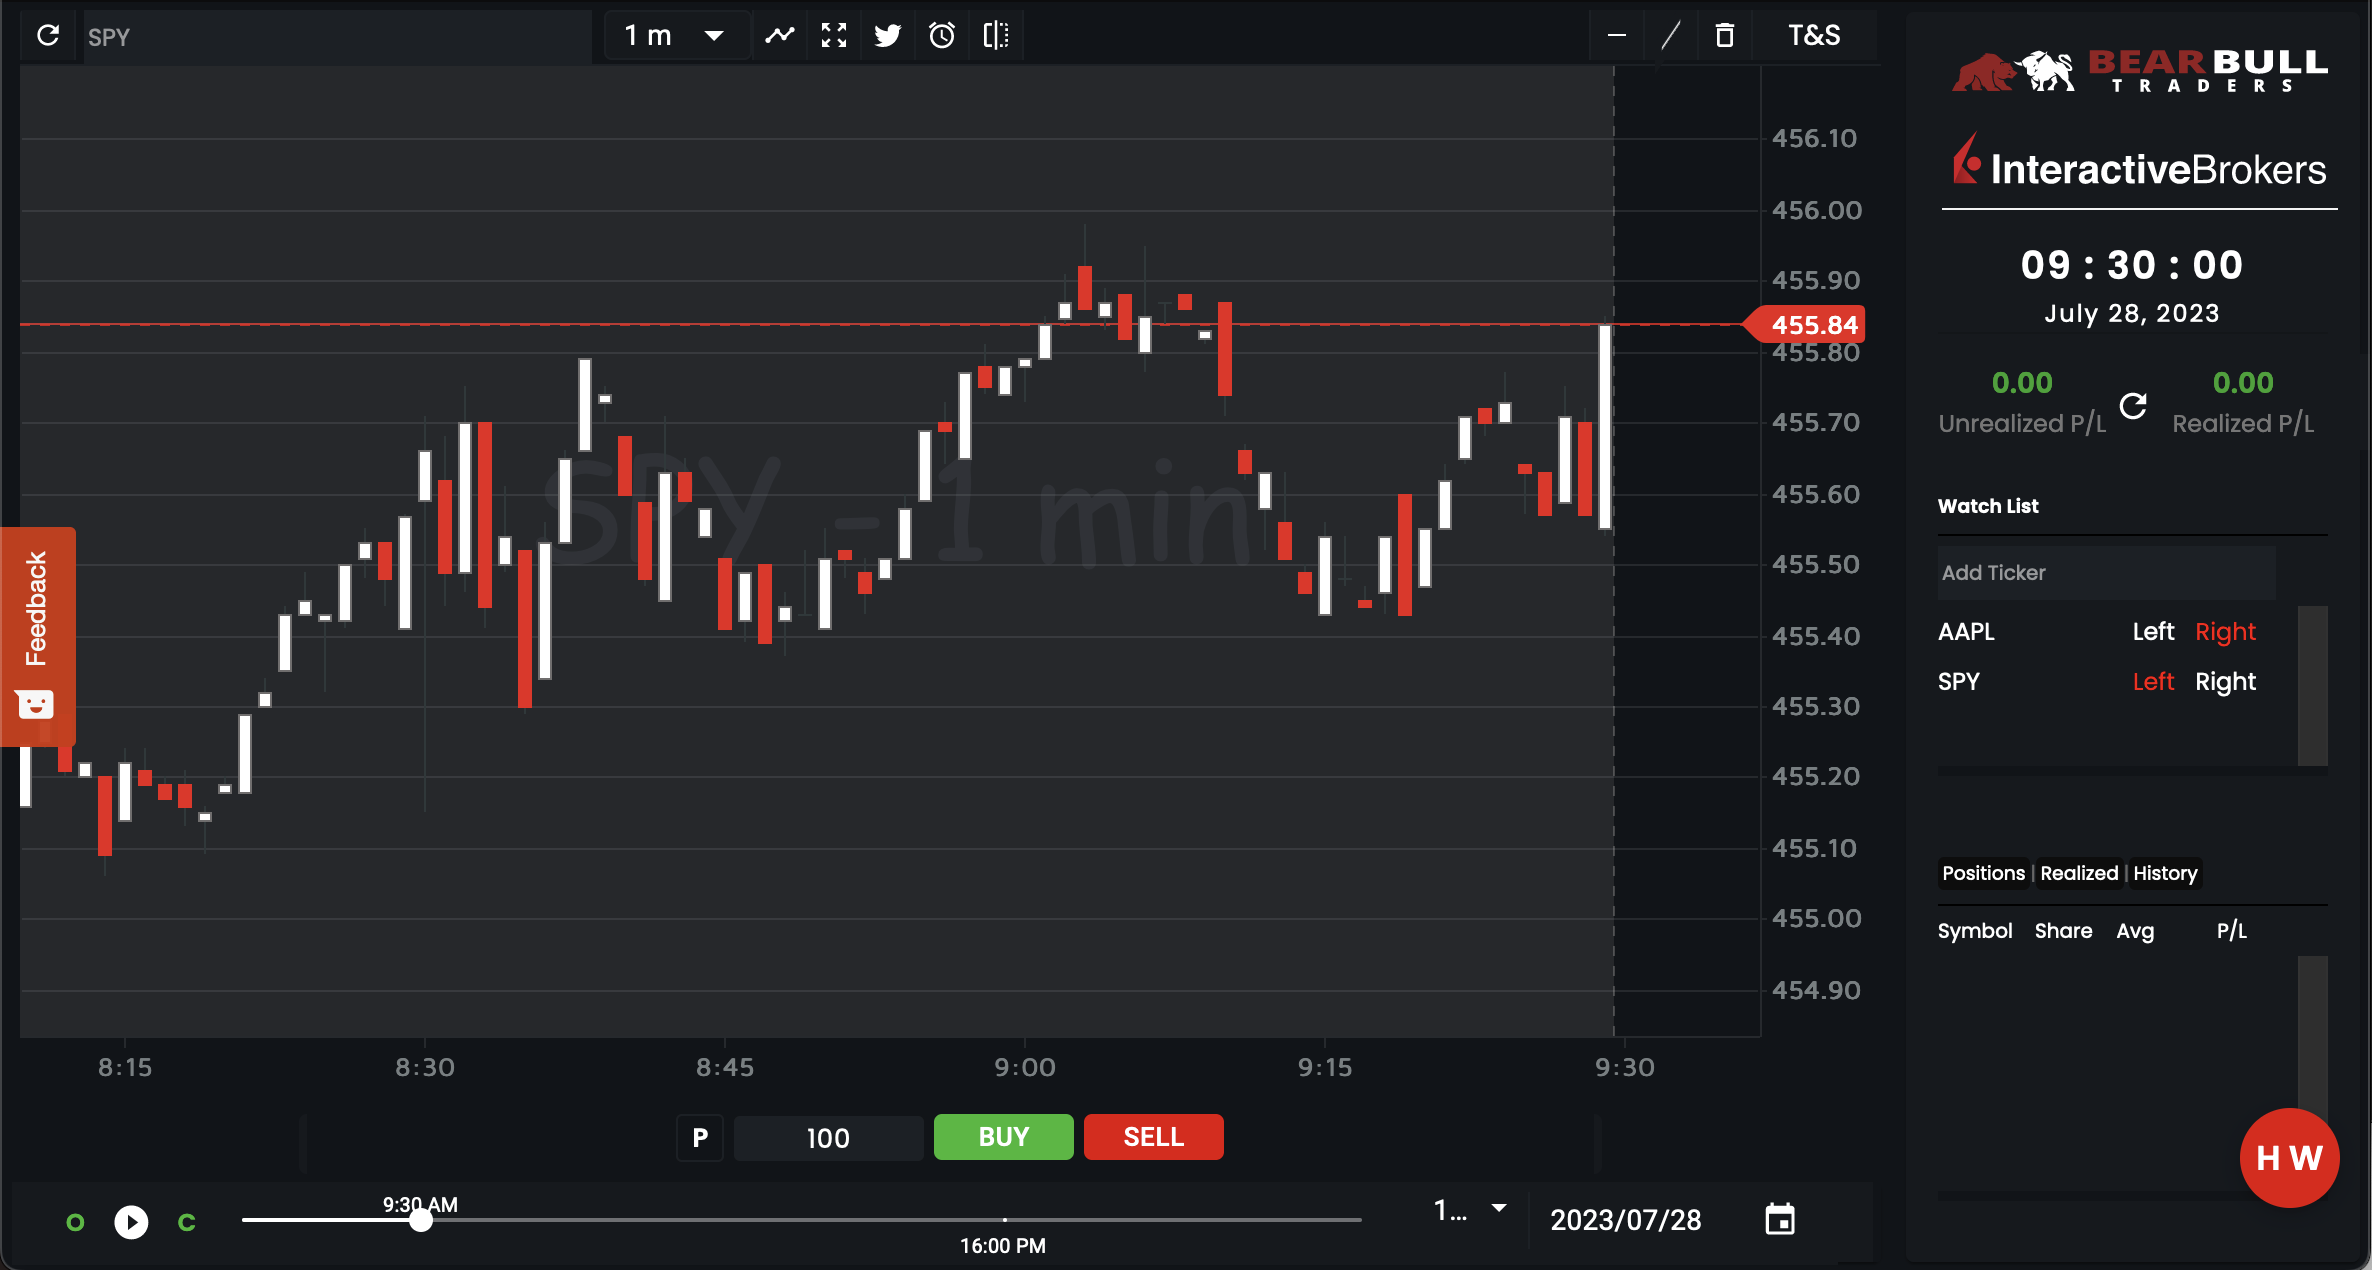
Day Trading with Options
I experimented with this all throughout Summer 2022. Unfortunately, this is the one kind of trading where I haven’t been able to find consistent success.
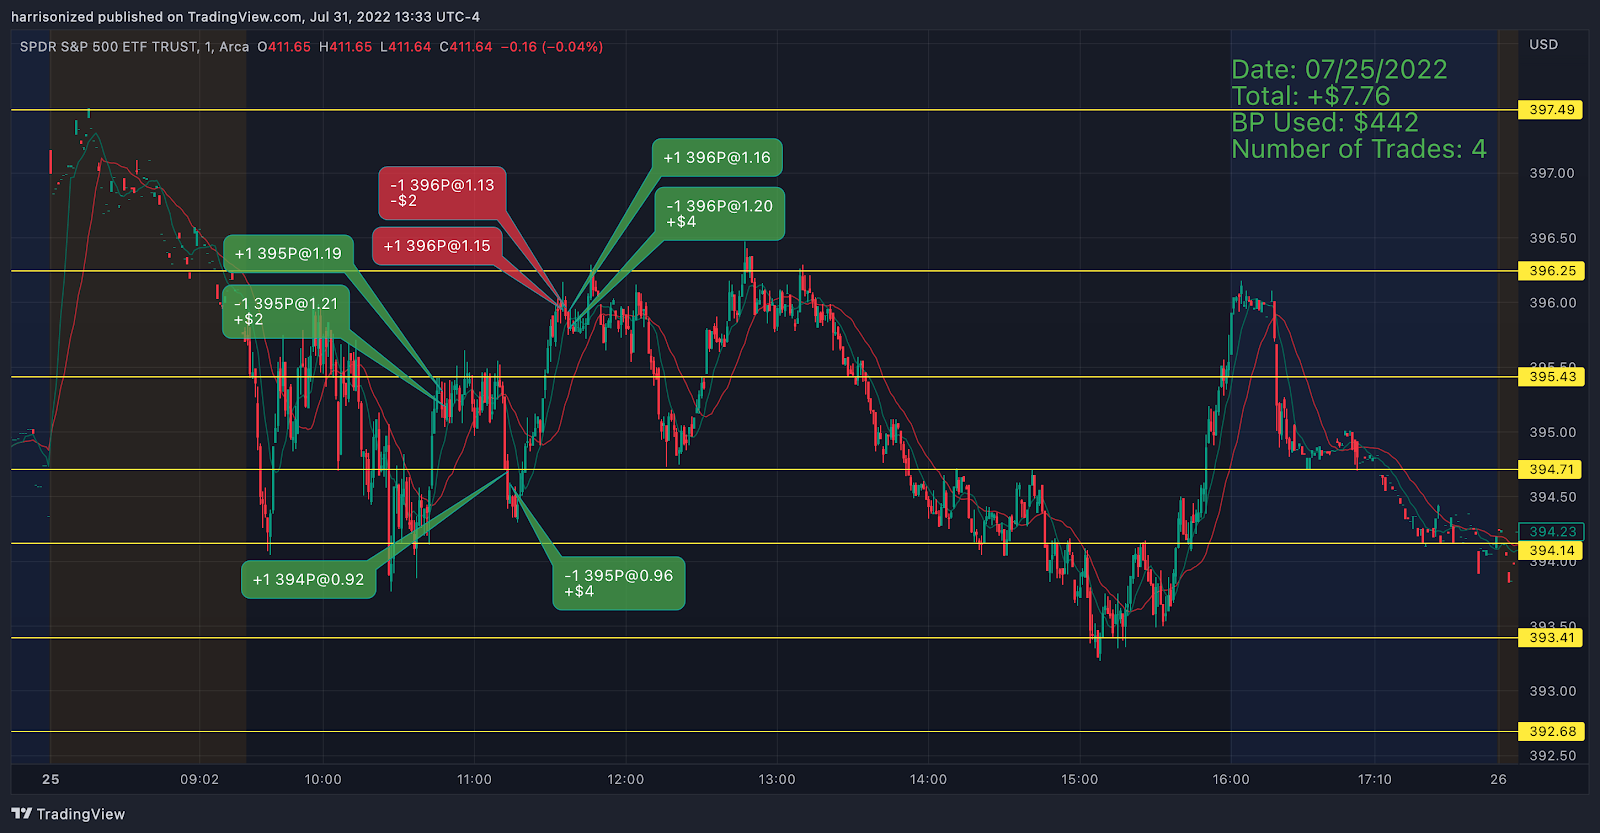
Here is one of my better days. I only made two trades, and both were good entries and good exits:
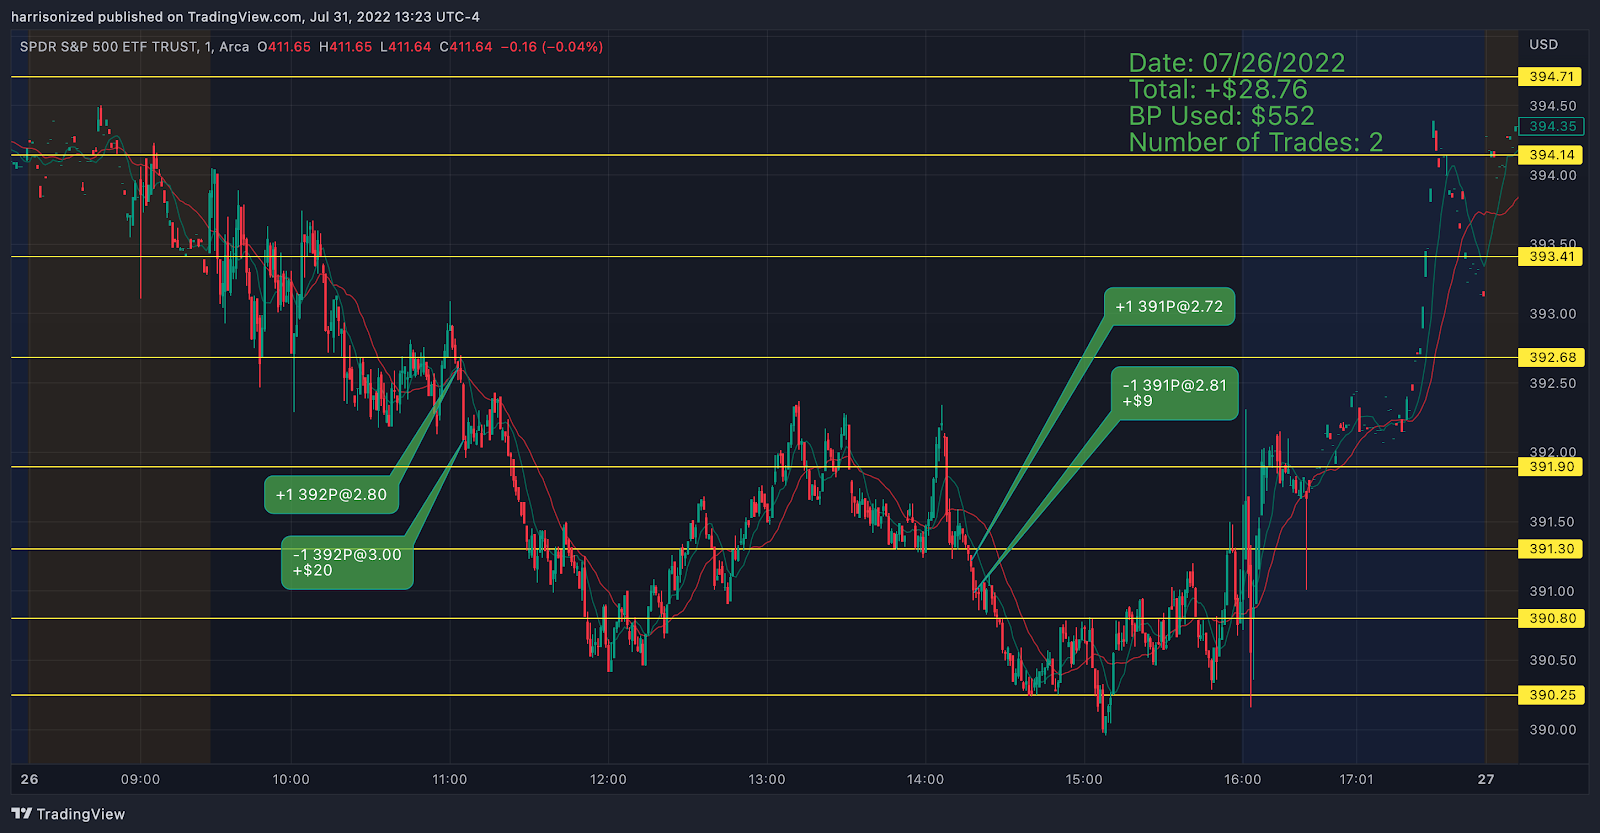
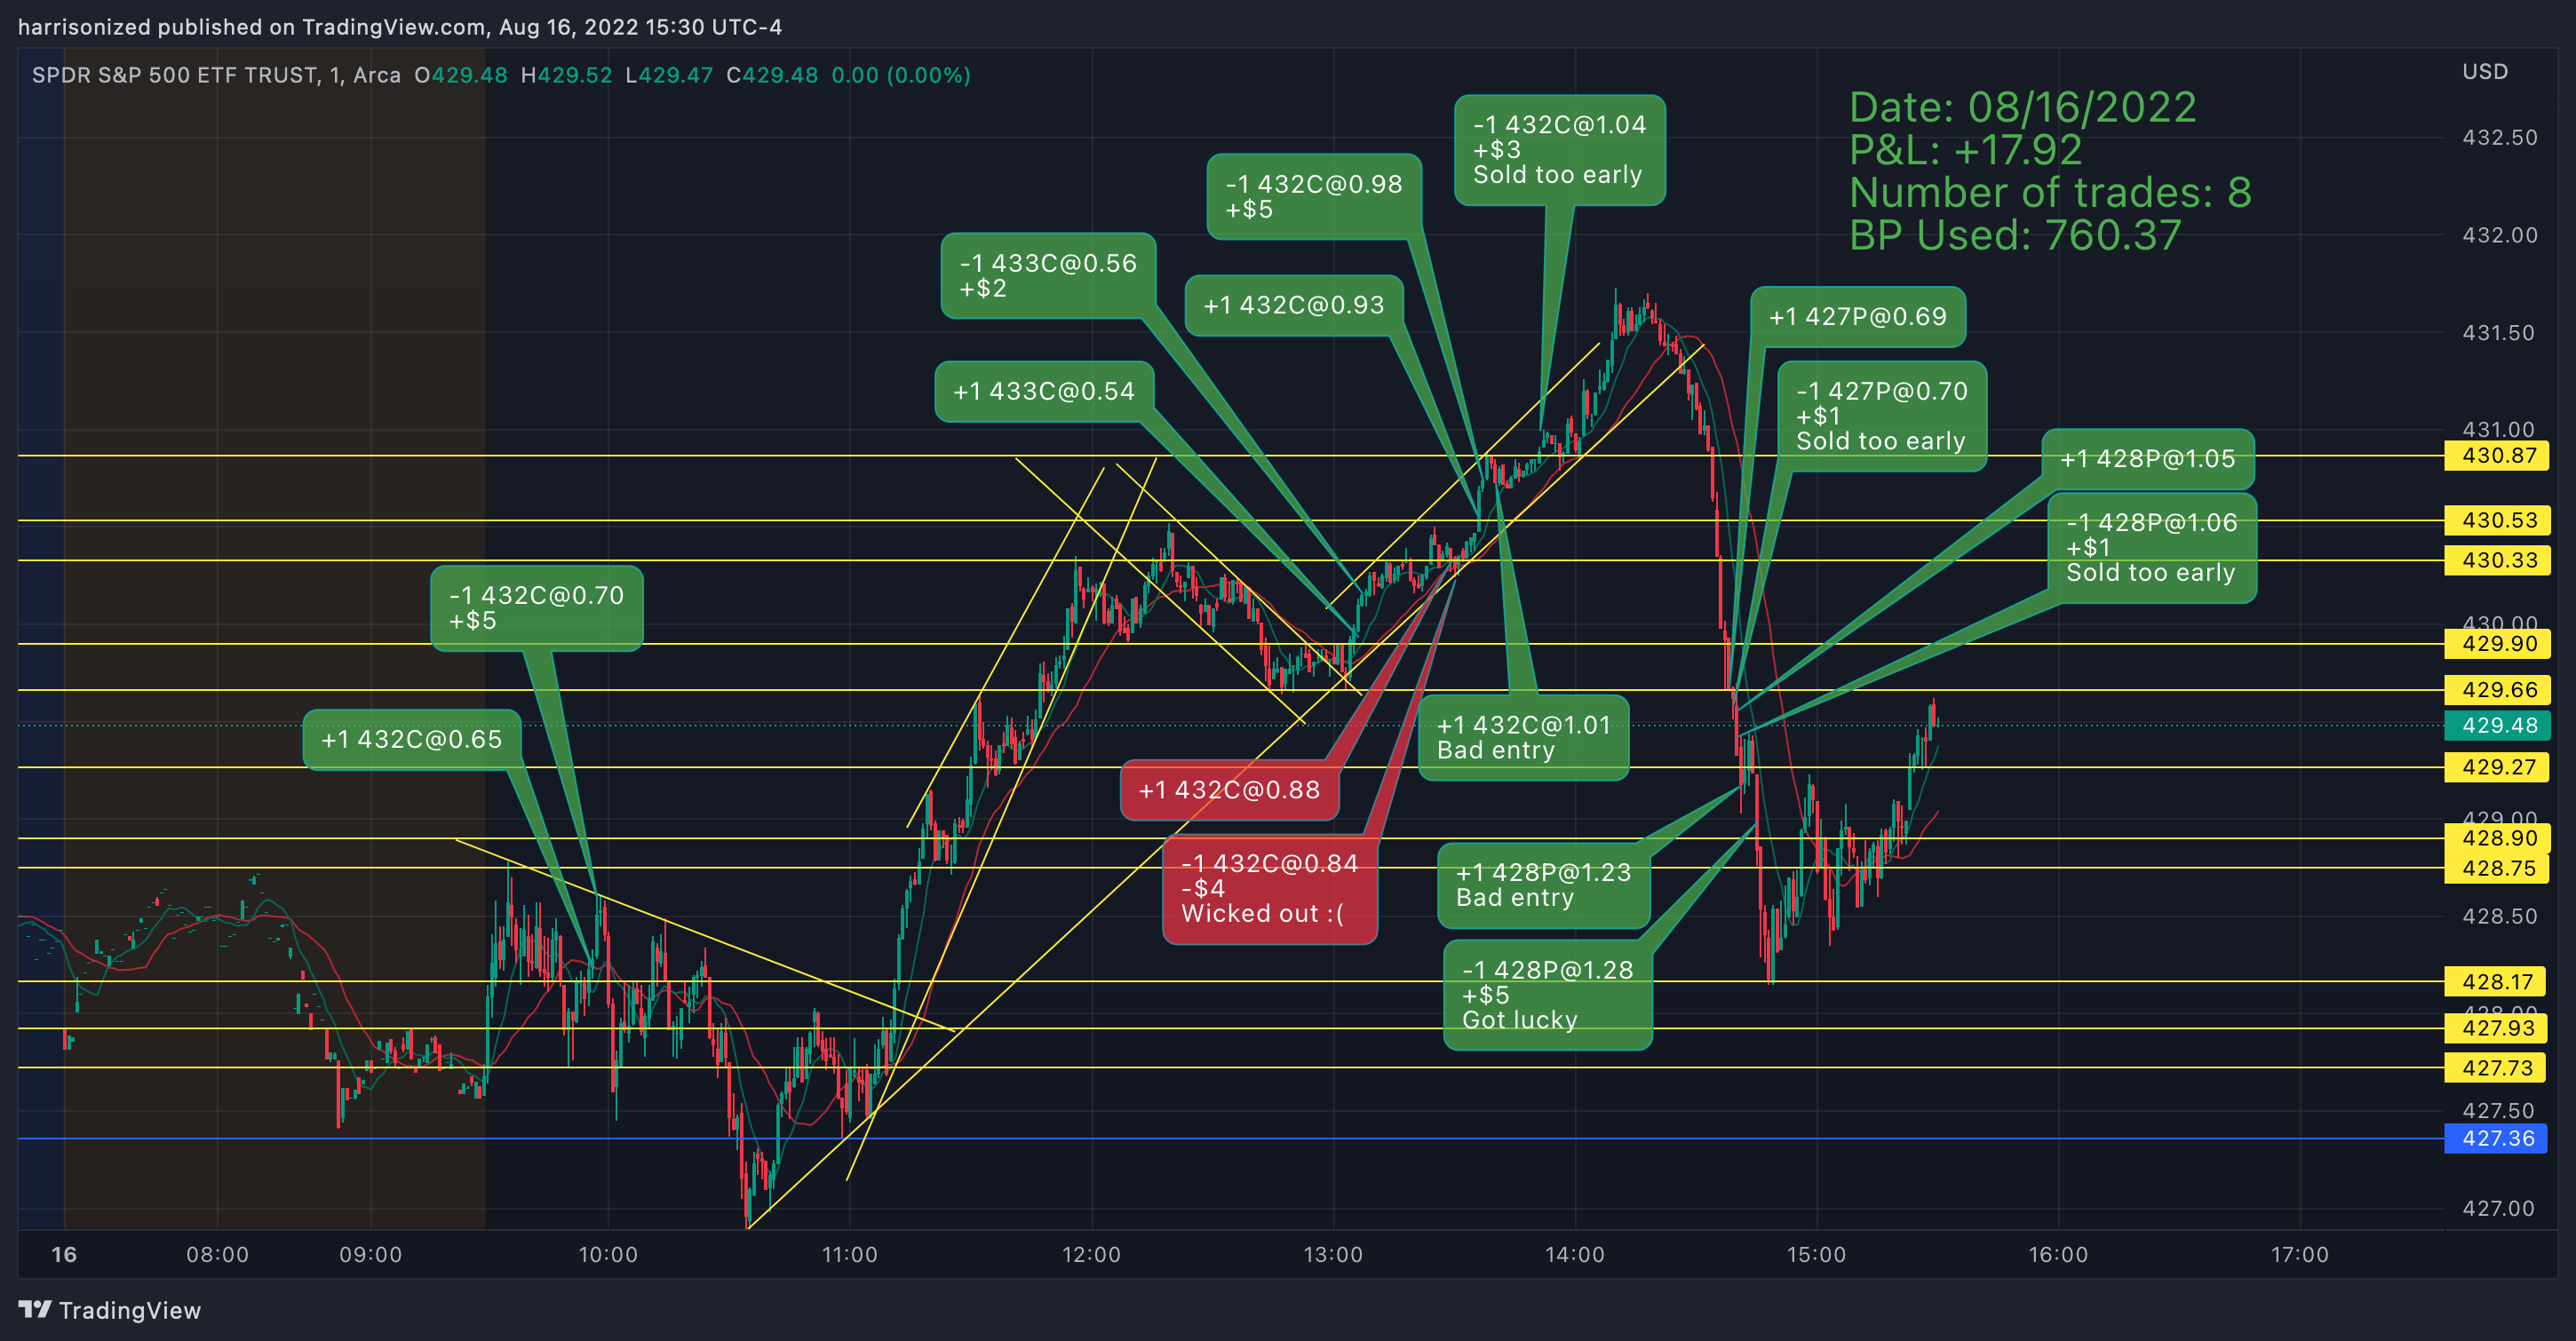
Here’s a day when I was less successful. Even though overall, I was profitable, all of my trades happened when the market started chopping sideways, and I didn’t capture any of the major market moves that would have been very profitable.
Lastly, here’s a terrible day. I overtraded and failed to recognize when the market dumped massively due to a news event:
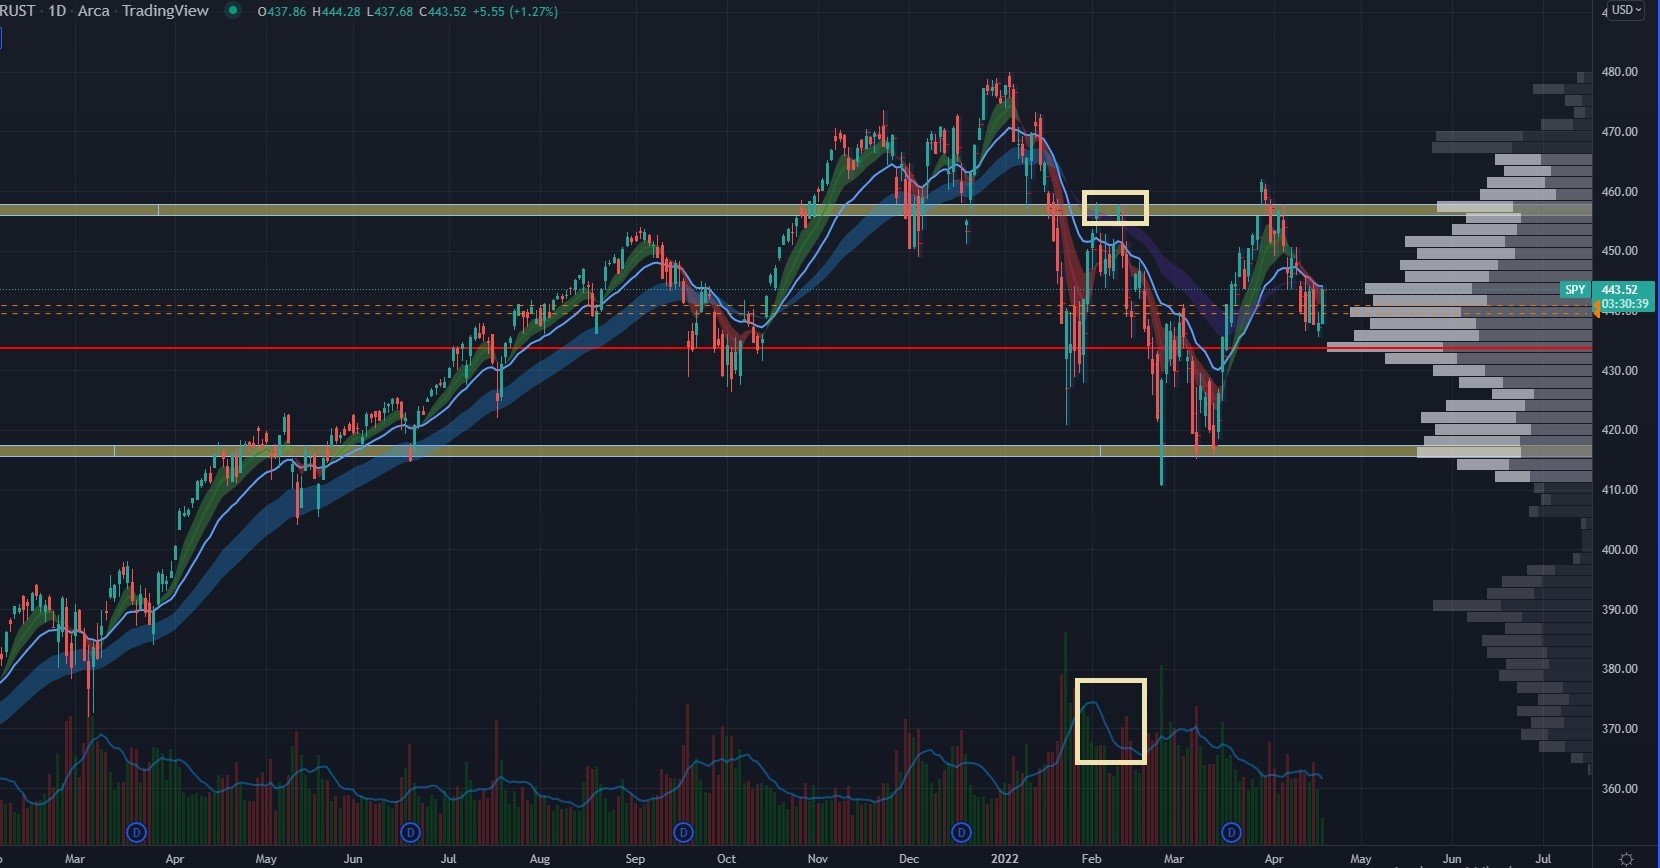
When you trade for real, it is imperative to keep a trading journal, much like the one I have here. I made these charts with TradingView, making it very easy to see exactly what I did wrong so that I can try to avoid it in the future. Of course, it’s always very difficult in the moment to follow through with your plans, but that’s why the Trading Replay app is so important. To see how to trade SPY correctly, I reiterate following Jimmy from TradingDecoded.
Buy the Rumor, Sell the News
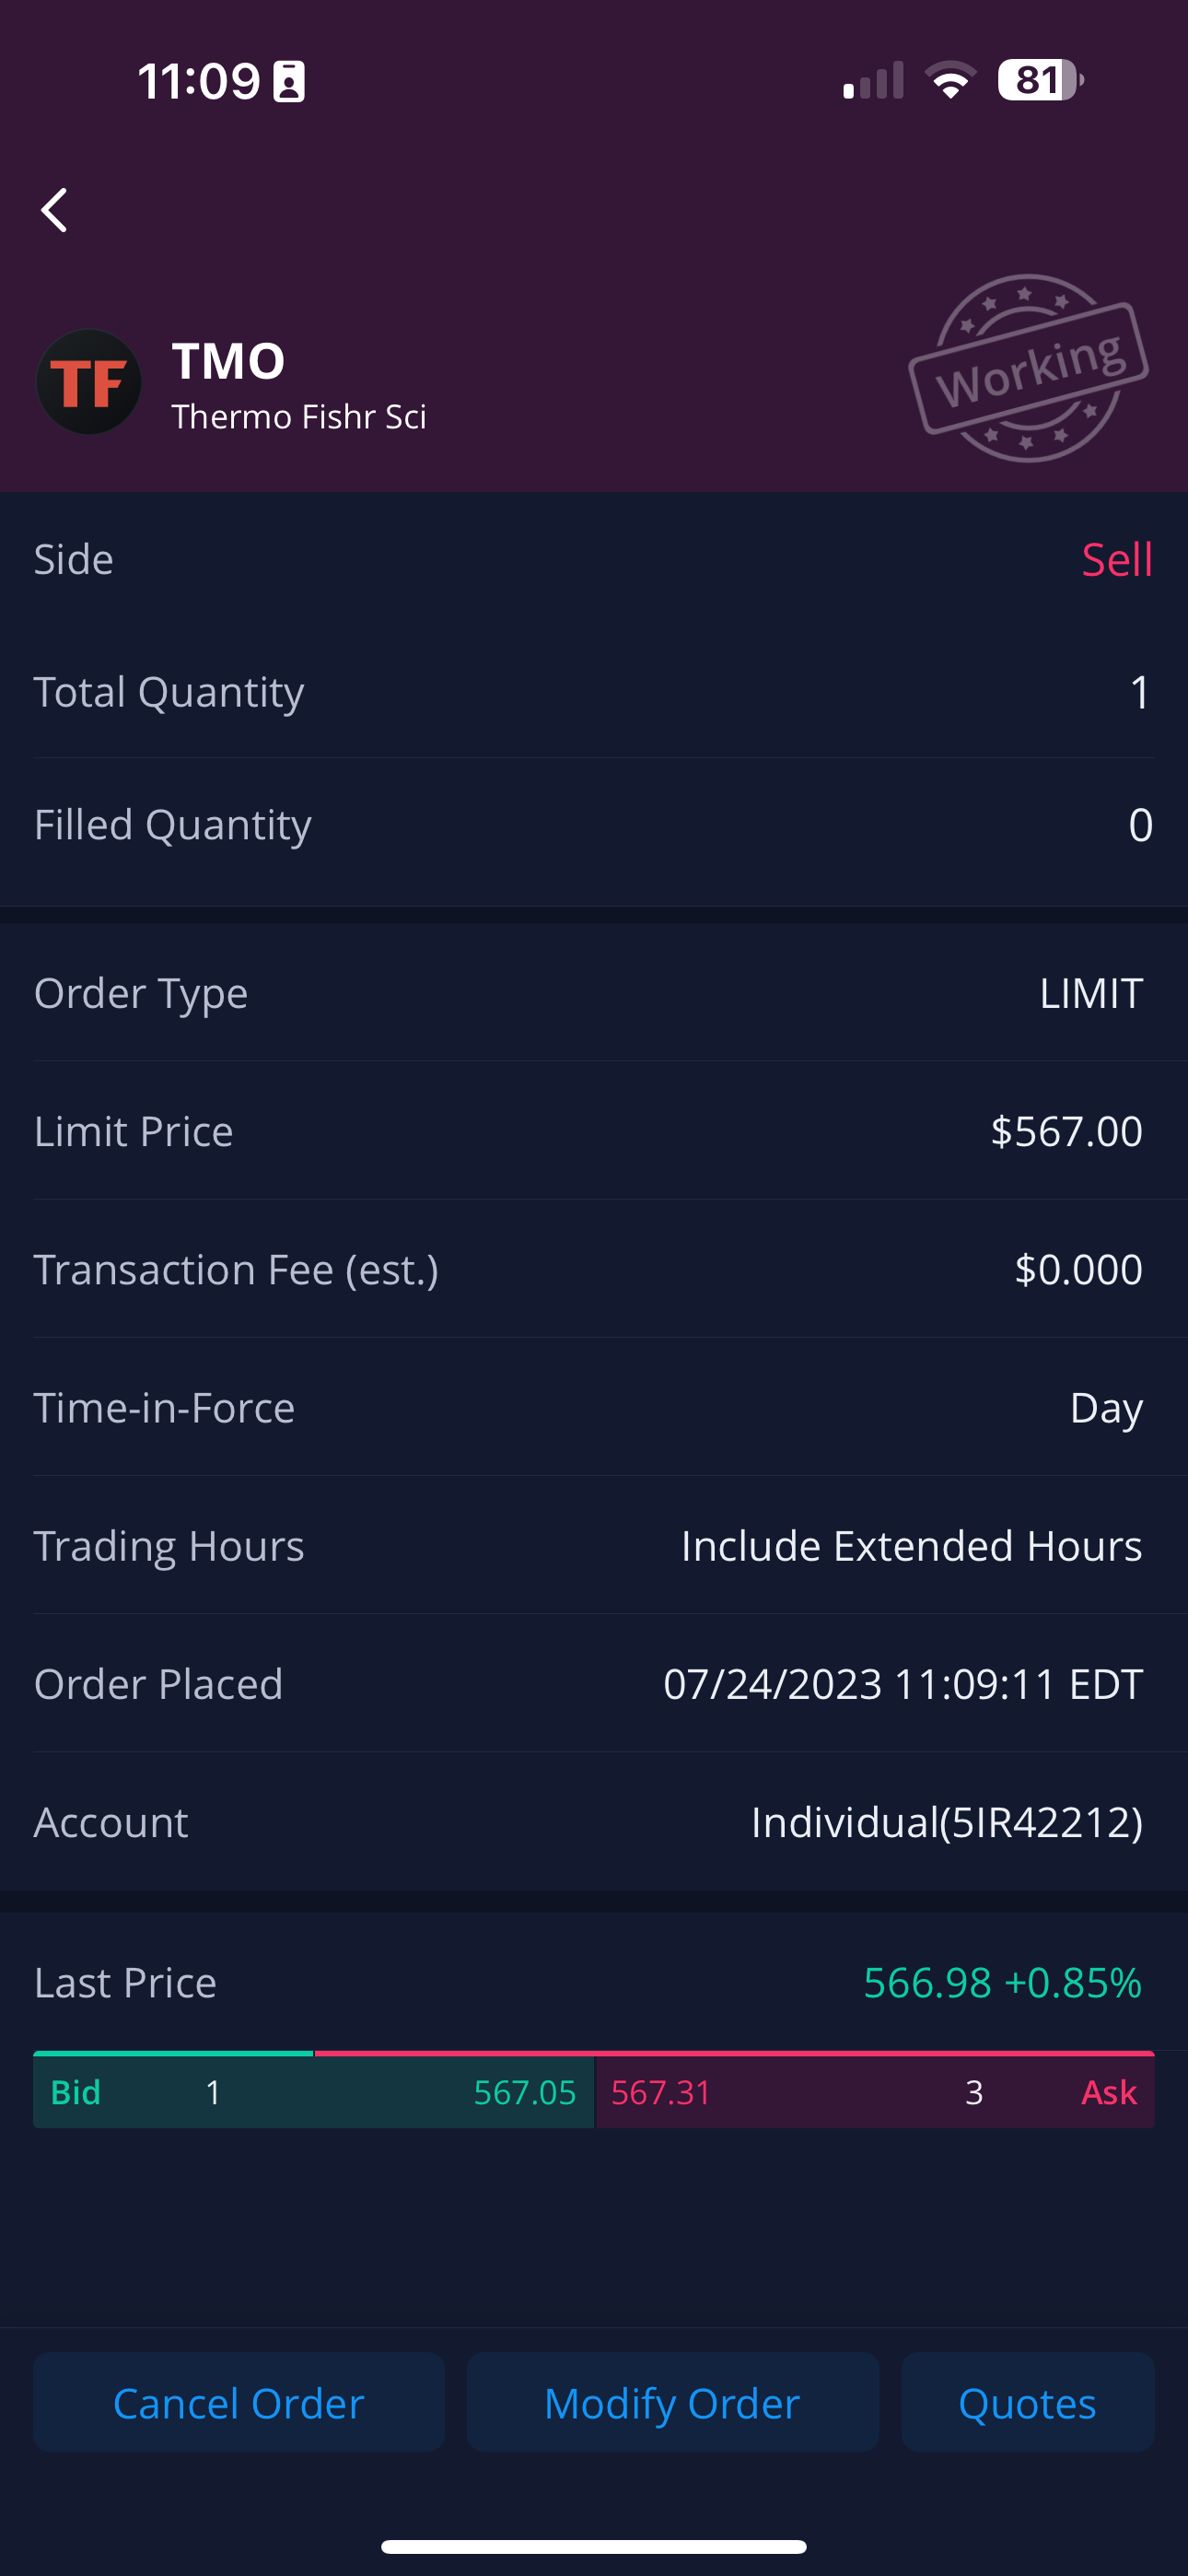
In July, 2023, I was watching TMO pretty closely, as earnings was approaching, and it was widely anticipated that they would beat earnings. Additionally, I noticed they had a strong support line at $515. So I bought 1 share and held it. When it spiked up to around $570 a few days before the earnings, I took profits, making about a 10% gain.
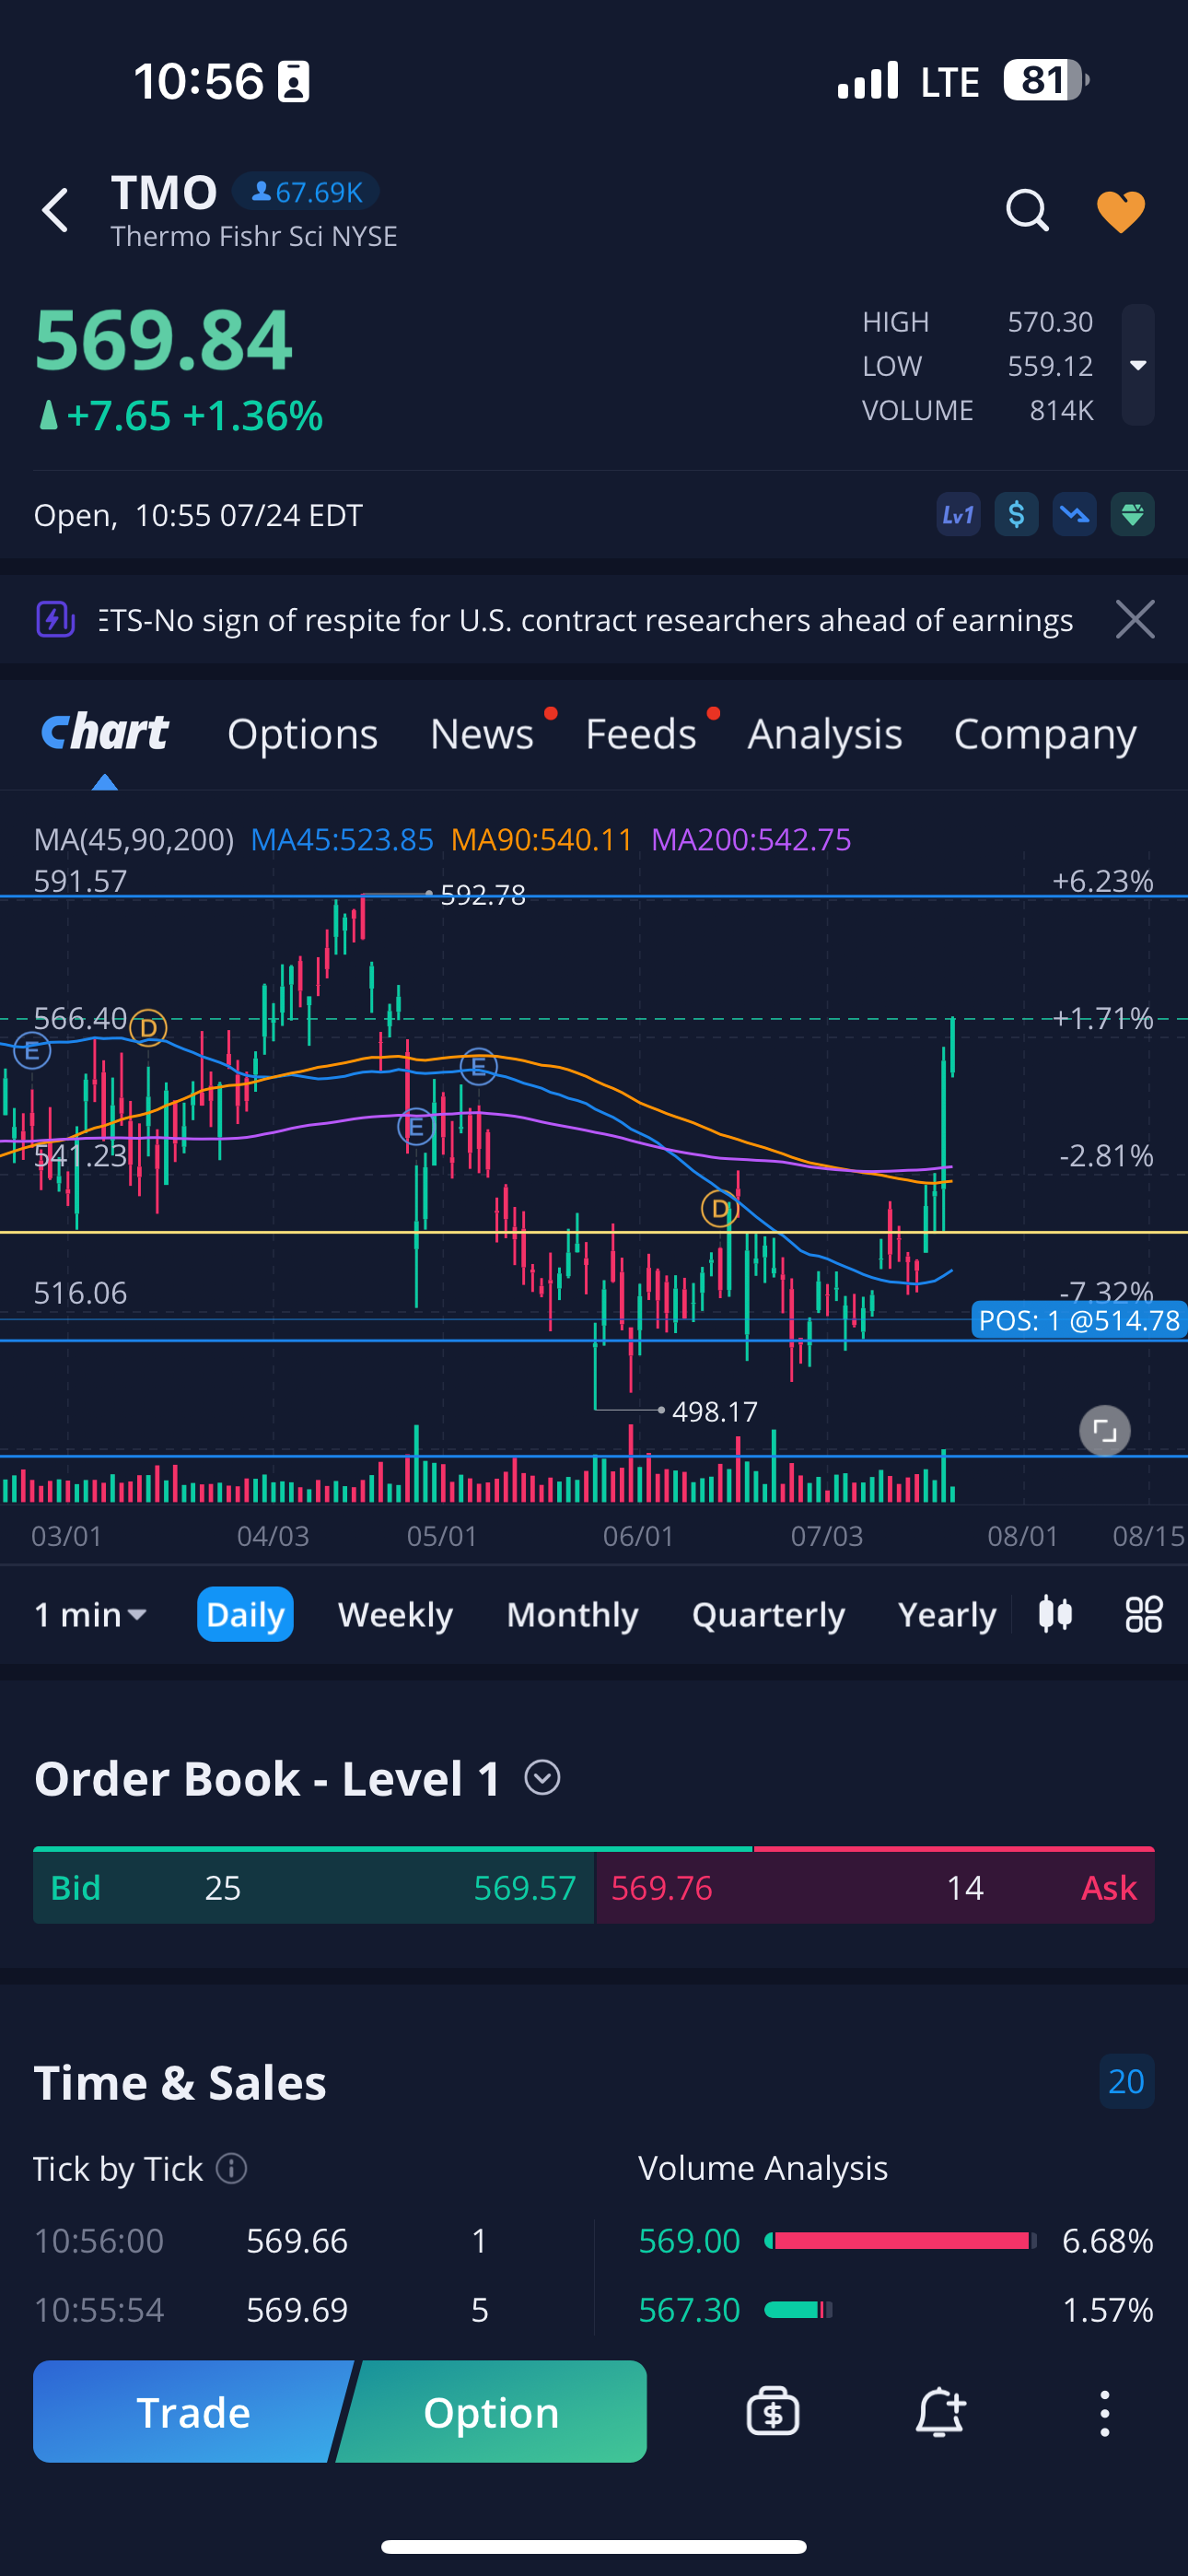
Indeed, after the earnings, during which they slashed their forward guidance, they dropped dramatically.
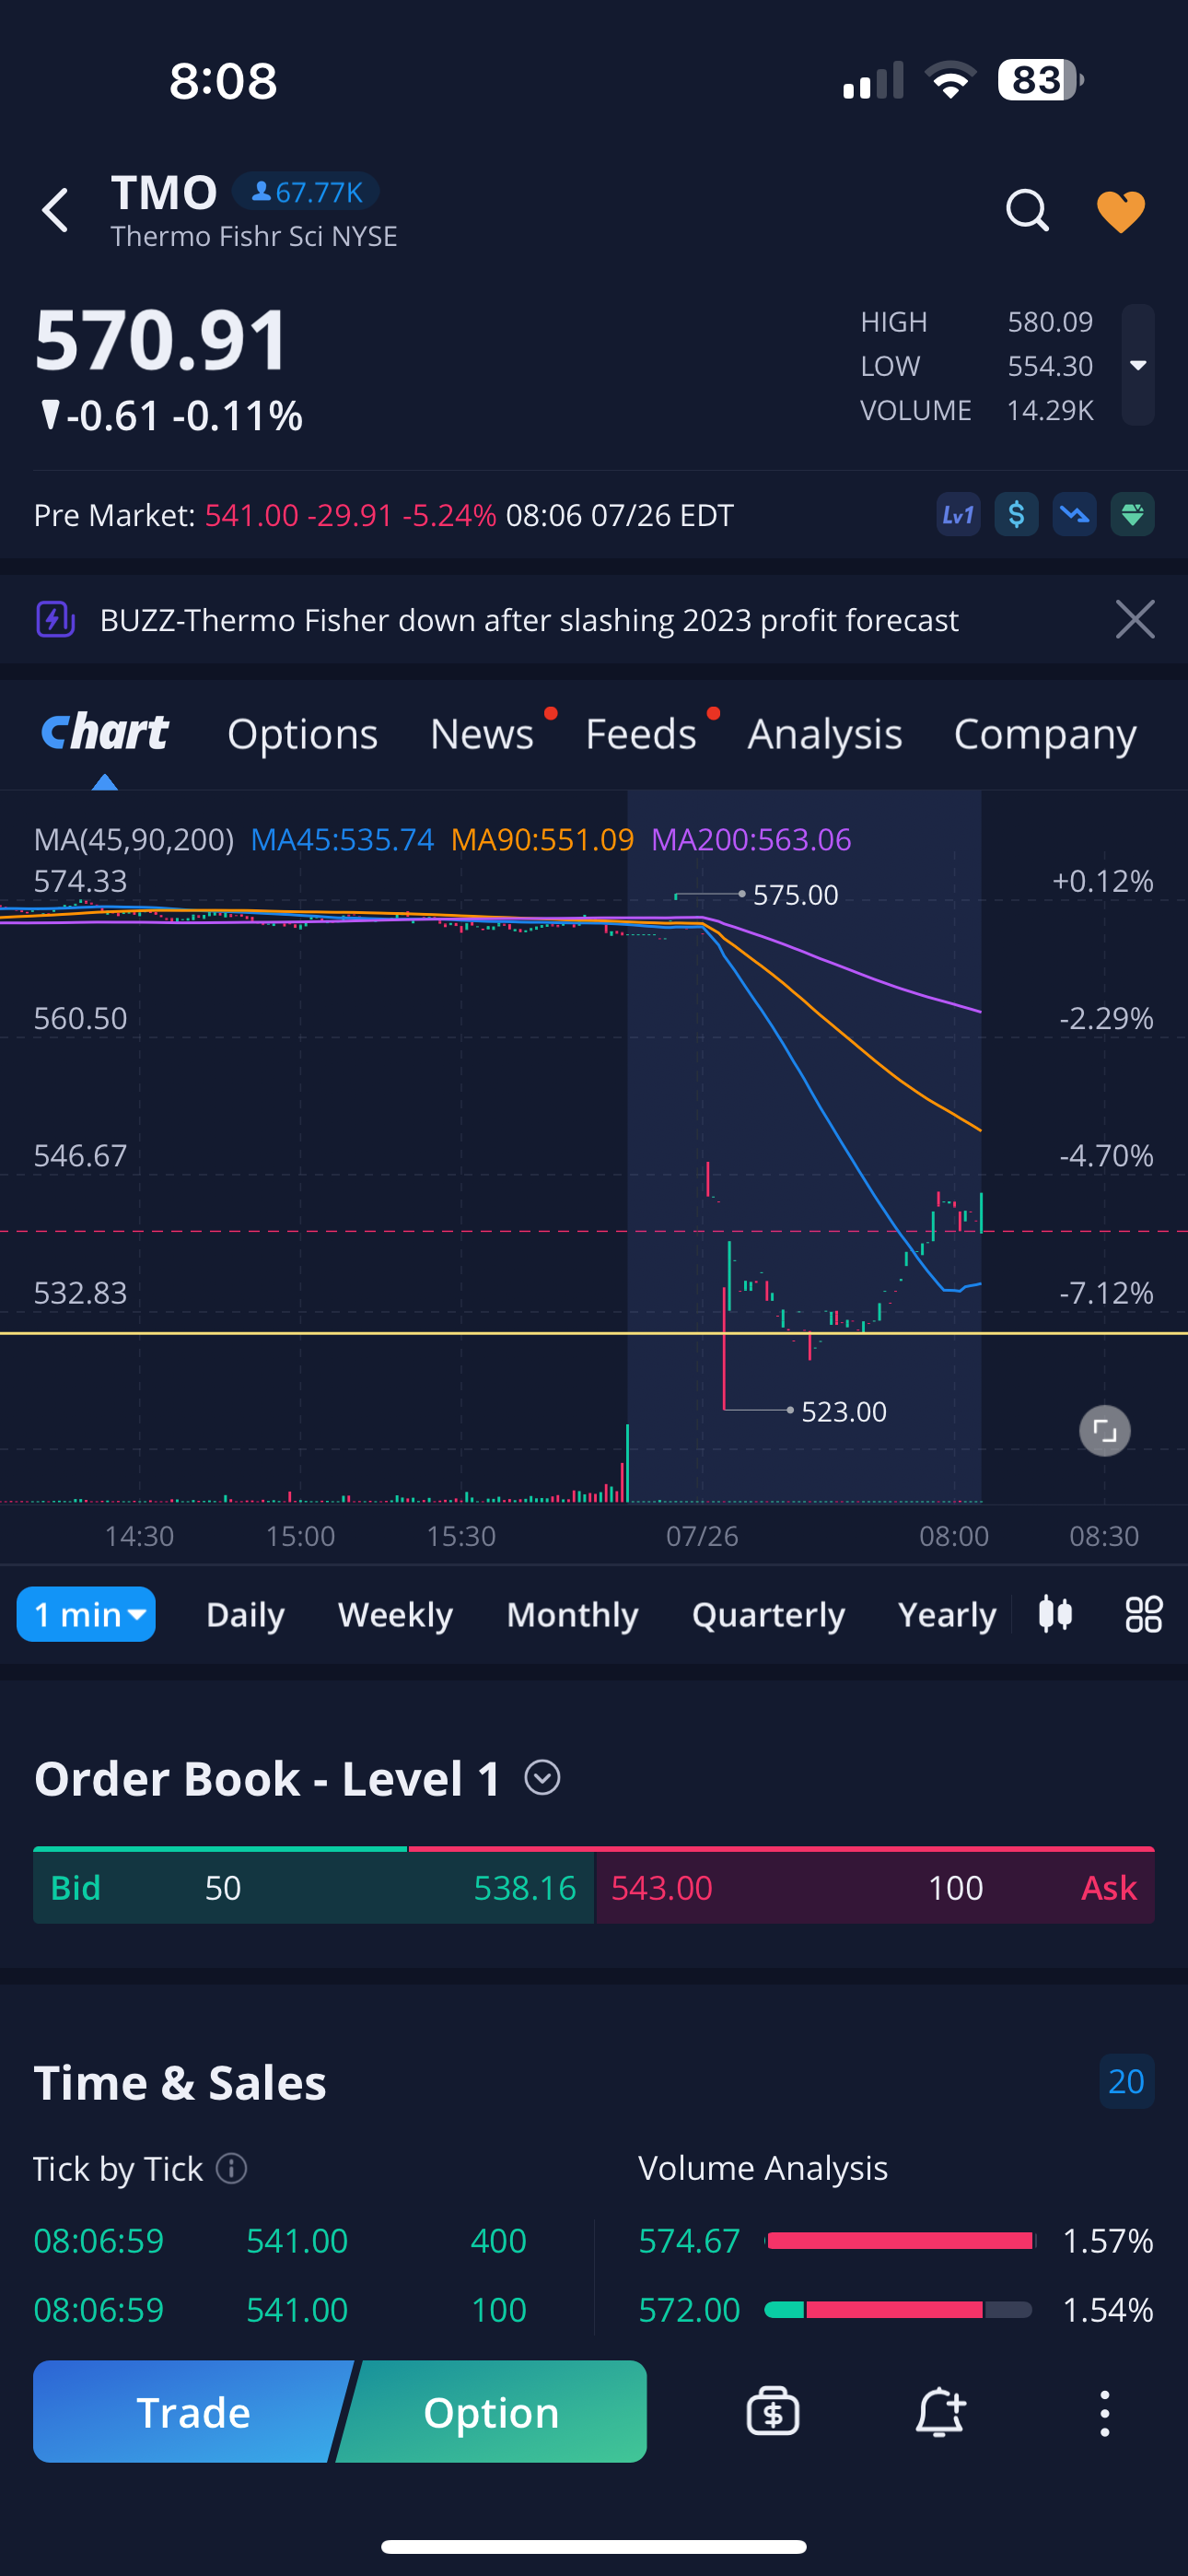
However, by some miracle, the drop was extremely short-lived. As of this writing, they trade at around $560, with a support found at around $555, which are both below my take-profit price.
Earnings Plays with Options
In October 2022, META was trading at around $130 per share. Suspecting that Facebook (META) could fall off a cliff, I purchased a single put option with a strike price of $100 for $23. (Note that the way this is displayed in the app is $0.23, since this is the per share price, and each options contract controls 100 shares.)

Overnight, META fell to $103, briefly dipping below $100 at open the next day.
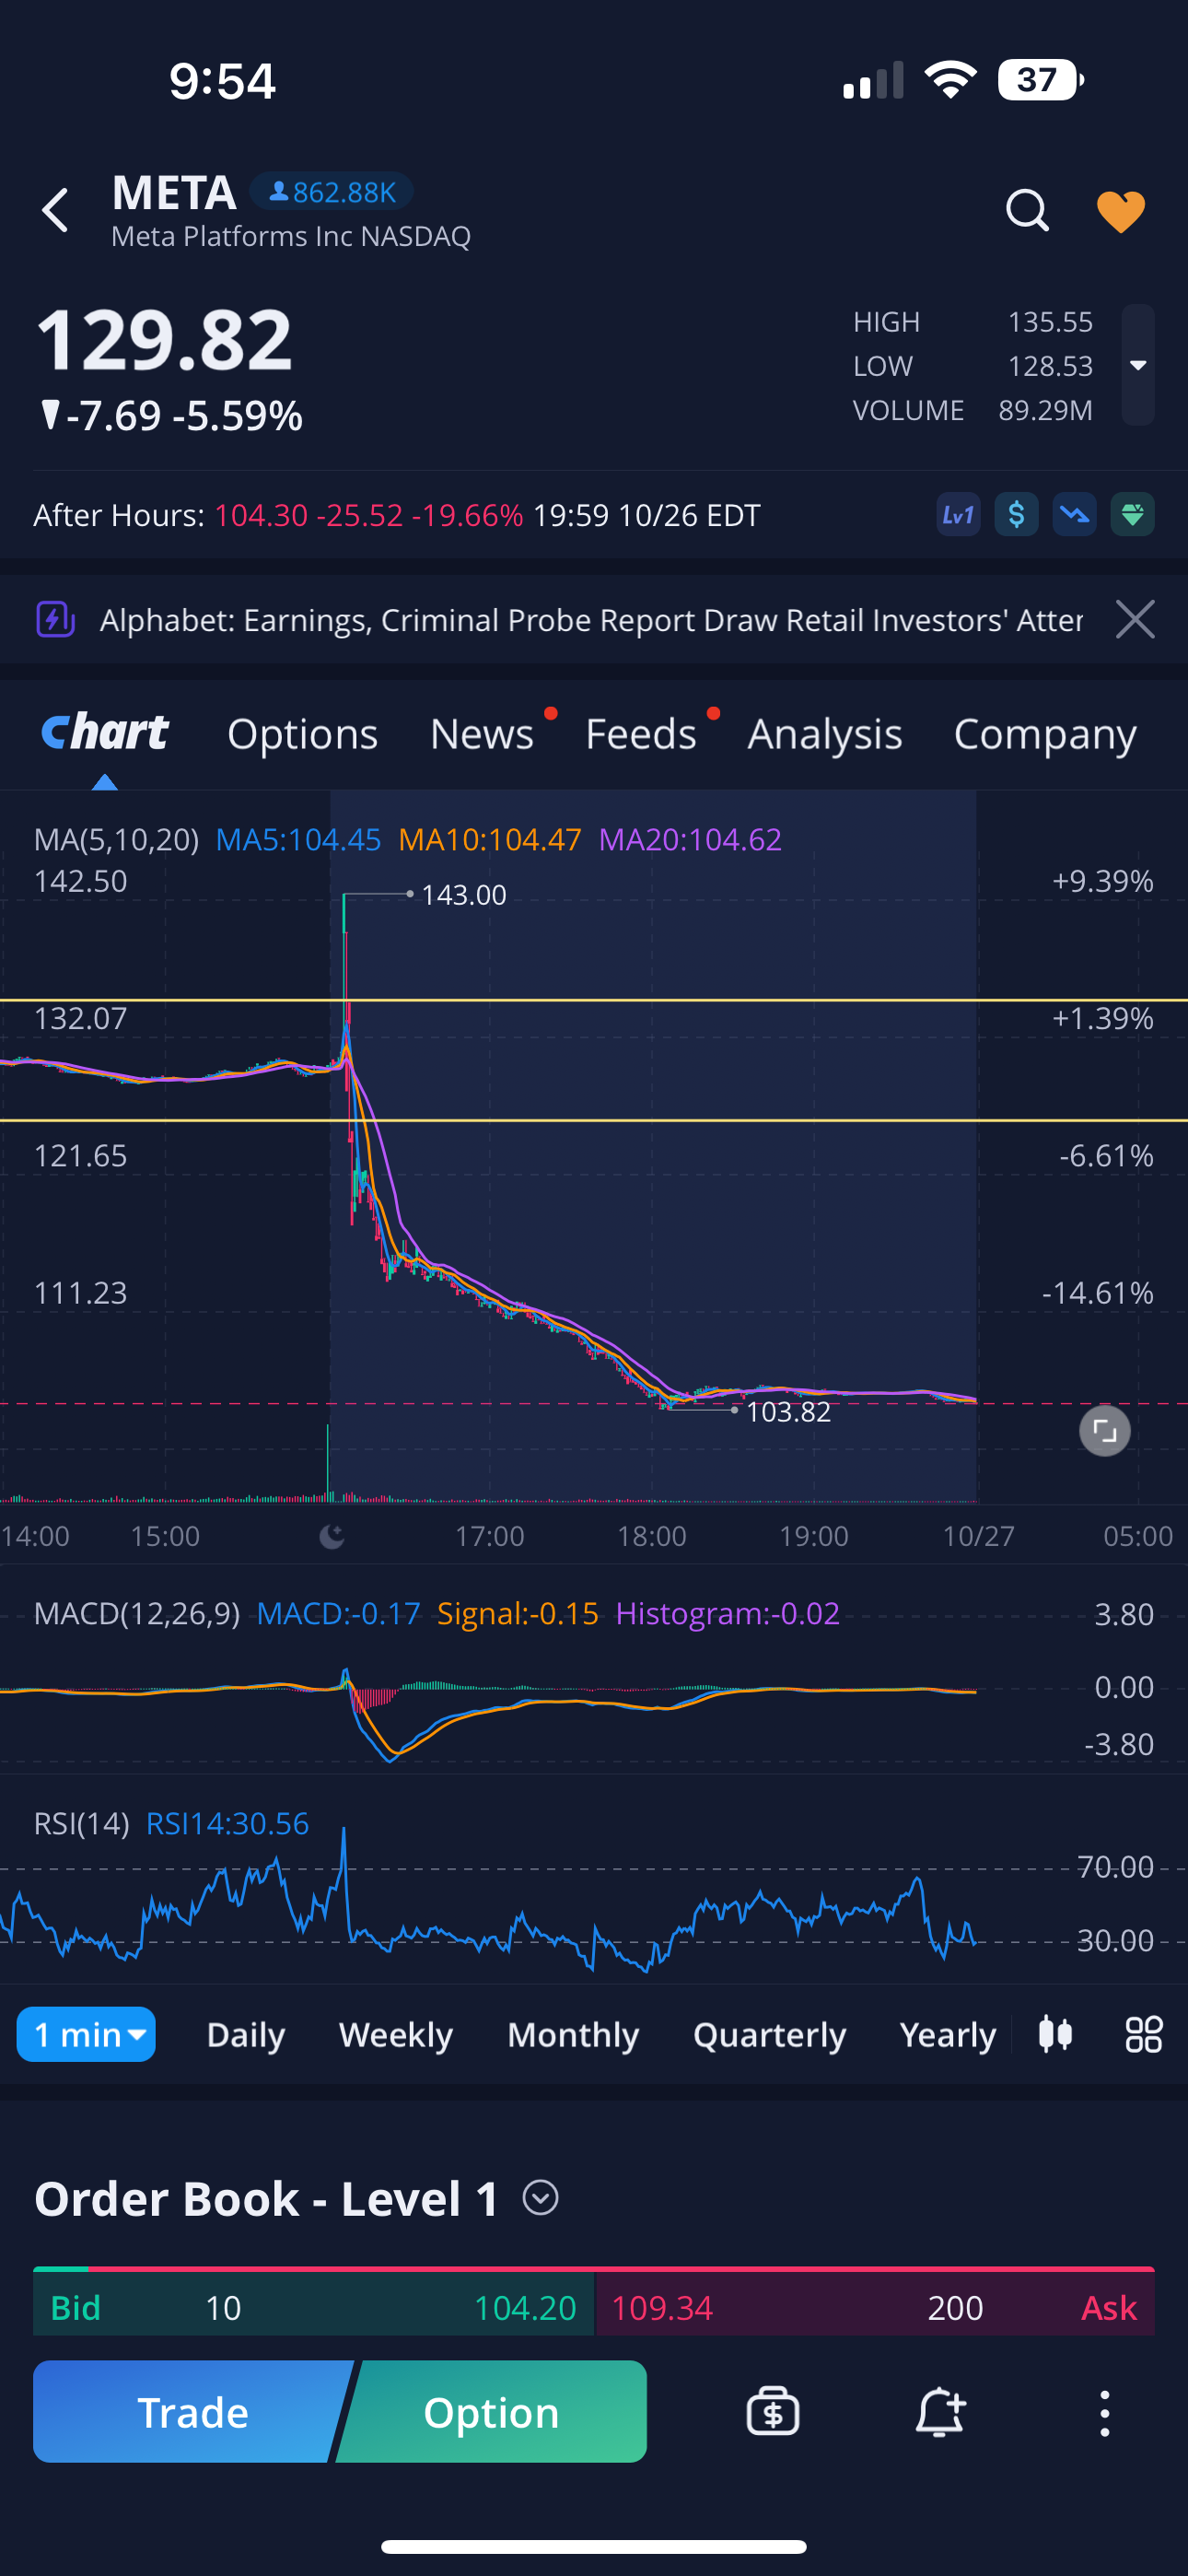
As a result, because my put option was pretty close to being in-the-money, it rose dramatically in value. I ended up selling it for $320, basically over 10x-ing my money.

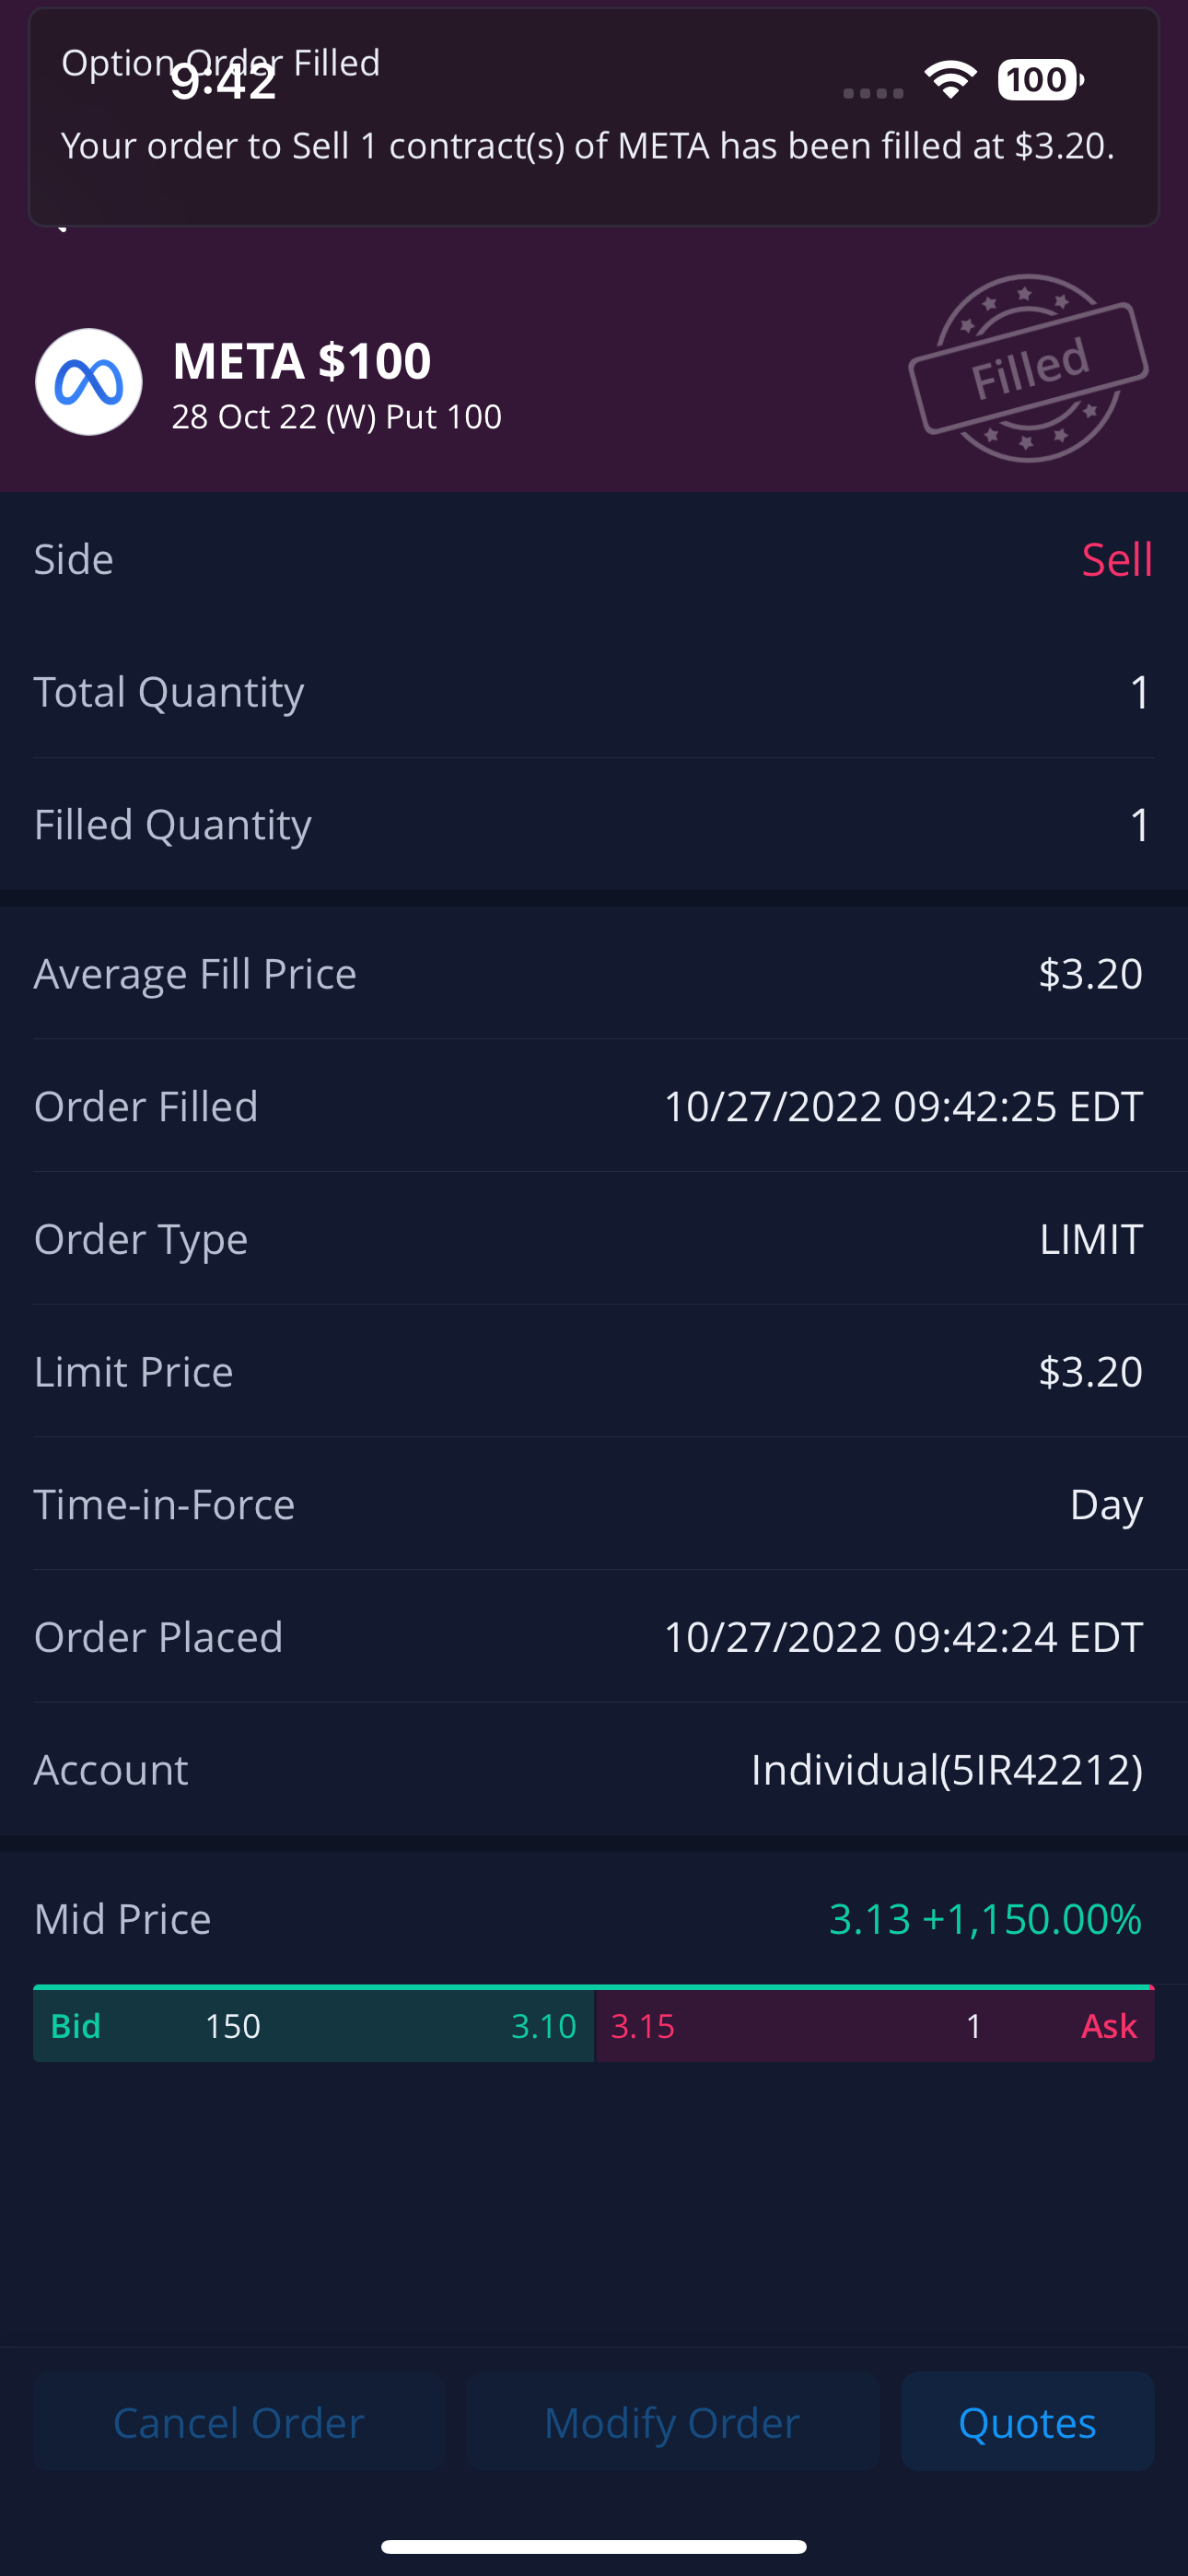
This was one of my most profitable trades of all time.
Important Resources
| Resource | Type | My Thoughts |
|---|---|---|
| Stock Curry | News | This is where I get most of the market news. Having worked in the financial sector through the 2008 financial crisis, Scott is very cautious about the market, often warning of signs and signals that can crash the market. He correctly identified that we were in a bear market before the market started falling dramatically in October 2021, and he follows the announcements of the Federal Reserve pretty closely. He often focuses on the fundamental reasons underlying market movements, such as Fed policies, earnings reports, and news events. |
| TravelingTrader | News | This is where I go to get market news when I don’t hear a good explanation from Stock Curry. He has a much more bullish outlook on the market, because as a day trader, he bases his opinion more on the technical data rather than the fundamental reasons underlying market movements, so his opinion often times offer an alternative explanation for market movements. Sometimes, I like to listen to both to compare. |
| ZipTrader | News | Charlie has a whole video series of tutorials on market basics like how to read candlestick charts, how to draw support and resistance lines, how to use indicators like the moving average, exponential moving average, or RSI, and this is where I started my financial education. I highly recommend starting with these videos, as the content is extremly high quality and timeless. I even paid for the ZipTraderU course, but having done the course, I’d say that his public content is sufficient. After I successfully learned how to guage price action via support and resistance, I find the rest of the indicators to be more distracting than helpful. Aside from the excellent tutorial series, ZipTrader also actively finds meme stocks that are running up, and often correctly identifies them before they start to run and often recommends taking profits before they begin to crash. |
| TradingDecoded | Tutorial | I watched Jimmy go from a relatively unknown solo trader to building a Discord community of like-minded traders. He is arguably one of the best day traders of this time and almost exclusively plays the SPY (or related SPX), making thousands of dollars a day. To be honest, I haven’t been able to reproduce his success, because I find it hard to see what he’s seeing in the moment, but in his Discord community, the things that he says are so spot on, it’s uncanny. |
| Thomas Wade | Tutorial | Thomas has a better video series on proper entries and exits for the SPY than Jimmy, but his strategy is also a lot more stringent, because he only wants the highest quality setups, whereas sometimes you’ll see Jimmy doing much more aggressive setups. |
| TradingTerminal Replay | Simulator | If you watch enough of Jimmy’s videos, this is where you should go to practice your strategies, because nothing is better than being abe to practice in a real-time environment, without having to risk your own money to develop your strategy. |
| TradingView | Charting | This is the de-facto standard tool for charting. However, I’m not a huge fan of the paywall for advanced features, and I personally don’t trade professionally or enough to justify the use of such a tool. |
| Webull | Charting | I discussed this at length above, but I want to reiterate how good of a platform this is. I do all my charting on this, and I love the clean, yet complex interface. Definitely try it out! |
| Taxbit | Taxes | I personally use this for my crypto taxes, because unfortunately, Coinbase and Binance.US currently don’t automatically give you a 1099 form at the end of the year like Webull and other brokerages do. |
| EarningsWhisper | Earnings | This is a good source of news for earnings events, however, I usually get the data from here indirectly, either from Jimmy’s Discord community or from Reddit or Twitter. |
| 1973, Grimes, The Art and Science of Technical Analysis | Book | Although this book was originally published in 1973, I think it still is the best book on learning technical analysis. After reading this, I had a deep appreciation that these methods are timeless, because they existed long before the advent of electronic trading and continue to be useful. This is absolutely a must read! |
| 1999, Buffet, Buffetology | Book | This is another classic book, written by Mary Buffet, the niece of Warren Buffet. This focuses on fundamental analysis and really goes into the details of how to properly evaluate a company and what it means to really invest, in other words, how to have conviction in the company you’re investing in. |
Outro
The stock market is a machine that reduces human behavior to a single number, encapsulating the greed and fear of cyclic human behavior. Although the market is constantly changing, from interest rate hikes from the US Federal Reserve to lawsuits that prevent companies such as Binance.US from allowing you to buy crypto using USD on their platform, the core principles of trading in the stock market remain the same, because human behavior hasn’t changed since the inception of capitalism. If you can train yourself to identify patterns and get in when others are fearful and get out when others are greedy, then this will be a profitable venture for you. Not everyone will enjoy the same trading style, and it will take much experimentation on your part to find the style that best suits your personality, but when you do, I guarantee that the persistence will pay off.
I hope you’ve thoroughly enjoyed this post, and if you do, please support me by using my Webull referral link. Thanks for reading, and happy trading!